
 Home
Home News
News
- The price of SOL falls as news for Raydium hack surfaces.
- The hack drained $120,512 SOL.
- The price is 95% below ATH which was recorded a year ago.
Exactly one year ago, the native coin of Solana, SOL, registered its ATH worth $260. But the overall scenario has turned the opposite due to the FTX debacle, and now it is moving into the bearish habitat. The tragedy was amplified, and the news surfaced, leaving the evangelists awestruck. The news snitched that Raydium Protocol, AMM on Solana’s network, was hacked, and a total of more than $ 4 million was played with, out of which $120,512 SOL was exploited. The exhaustive list of pools that the hacker exploited, some of which are SOL-USDC, SOL-USDT and RAY-USDC.
The aftermaths of hack
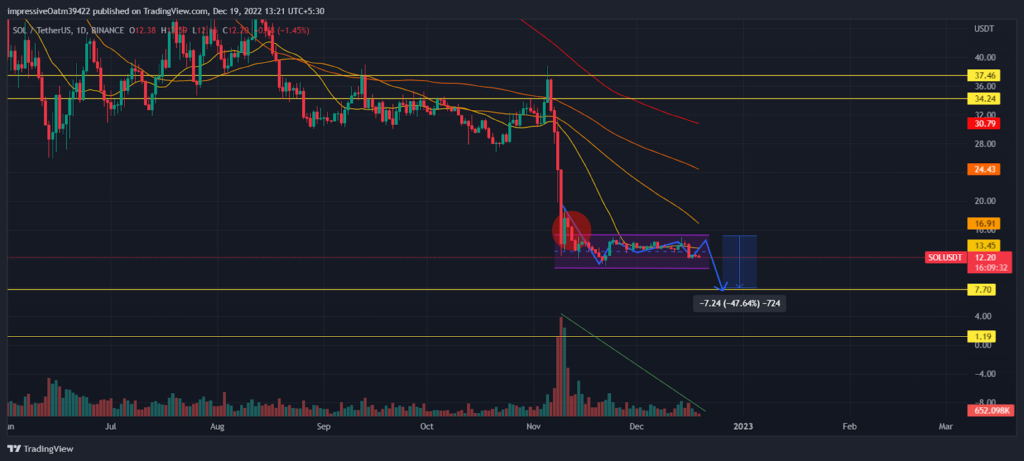
The SOL price has persistently moved in the bearish swing, where it formed 3 black crows (red circle) during the FTX crash and again showed a steep fall due to the aforesaid hack. The target level the price may reach after the fall is predicted to be near $8.00. The SOL token may also witness heavy seller volume as the price starts falling, which shows a descending trend at present. The price for SOL floats way beneath the significant EMAs.
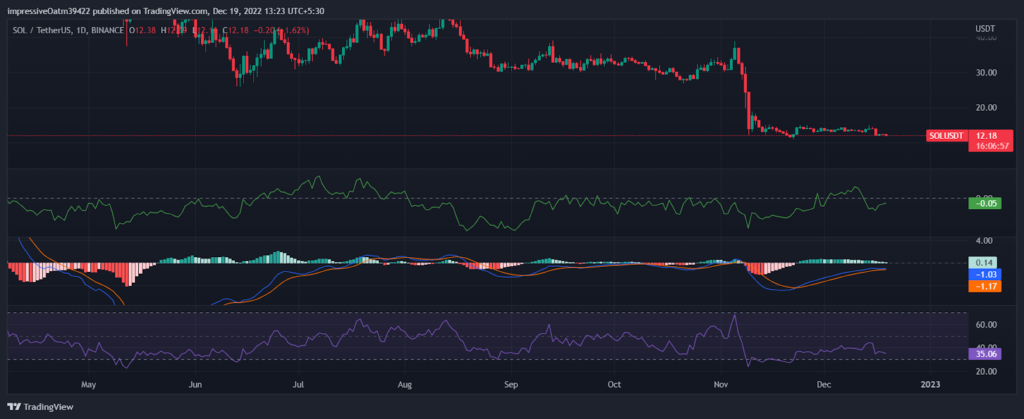
The CMF indicator floats below the baseline, indicating the price action currently taking place under the influence of the sellers. The MACD indicator is close to converging as the lines may coincide to end the buyers’ term paired with diminishing buyer bars. Also, the lines function beneath the zero-histogram mark, reflecting that the market forces are not at full capacity. The RSI indicator has oscillated in the lower ranges for a long and may further fall to the floor marking.
What’s the scene now?
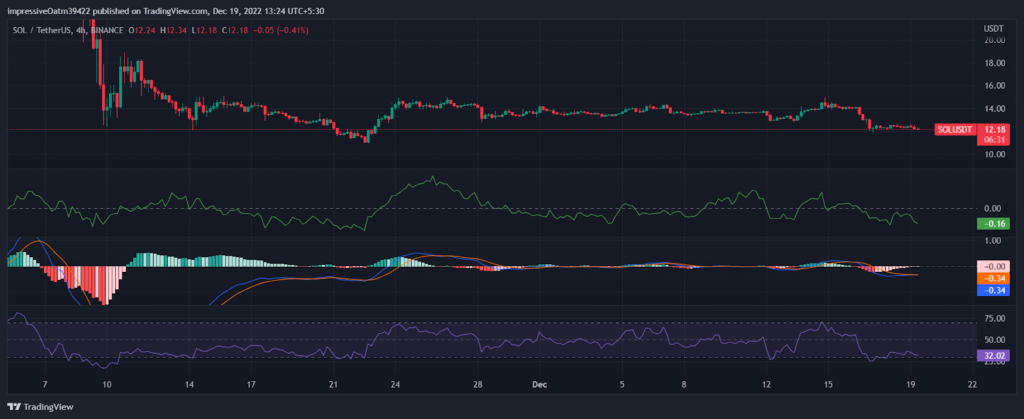
The current time frame displayed that the price has been facing immense pressure already as it fears the sell-off situation. The CMF indicator has maintained a spot below the baseline and may slop down to mark the downturn as the prices are predicted to fall further. The MACD indicator is in a tug-of-war situation where buyers and sellers pull the lines in their favor. The RSI indicator moves akin to the lower boundary and finds a place to hold as it can fall from here, with respect to the future fall.
Conclusion
The price situations for Solana are not very encouraging, rather pointing to a gloomy future. The prices are expected to fall, where past already marked bearish rule. The accumulated analysis is unclear but may hint at something tragic.
Technical levels
Support levels: $7.70 and $1.20
Resistance levels: $34.20 and $37.50
Disclaimer
The views and opinions stated by the author, or any people named in this article, are for informational ideas only, and they do not establish financial, investment, or other advice. Investing in or trading crypto assets comes with a risk of financial loss.

Andrew is a blockchain developer who developed his interest in cryptocurrencies while pursuing his post-graduation major in blockchain development. He is a keen observer of details and shares his passion for writing, along with coding. His backend knowledge about blockchain helps him give a unique perspective to his writing skills, and a reliable craft at explaining the concepts such as blockchain programming, languages and token minting. He also frequently shares technical details and performance indicators of ICOs and IDOs.


