
 Home
Home News
News

- AMC stock price has opened the day’s trading session at 2021 lows over the daily price chart.
- AMC share price is trying to recover till 20 EMA and is also below 50, 100 and 200-days Daily Moving Average.
- AMC Entertainment Holdings Inc’s stock price has dropped by 11.42% during the day’s trading session.
AMC stock price has been falling since August 2022 and slumped till 2021 lows, currently being priced at $4.71 losing around 11.42% of its market capitalization in the last 24-hour period. AMC share price needs to attract more buyers in order to retain its position at the upper levels over the daily price chart. However, volume tells a different story as it is above average and shows the accumulation rate of bulls during the day’s trading session. The continuous fall of AMC stock has been a matter of discussion between the stock market investors and traders through the year 2022.

AMC stock price (NYSE: AMC) is currently approximated at $4.71 and has lost more than 11% of its market capitalization (which is 2.459B) in the last 24-hour period. Average volume for AMC share price is currently at 27.216M.

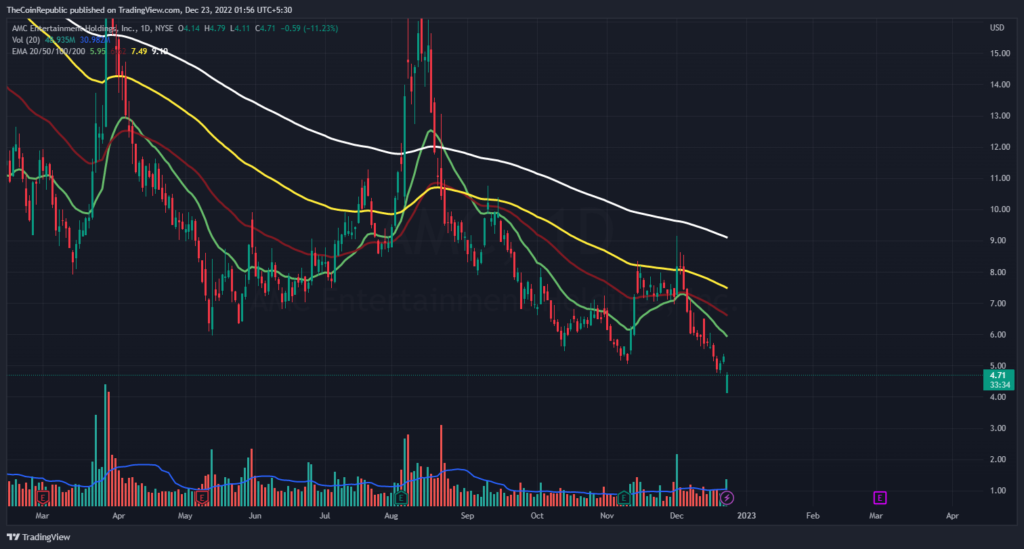
AMC stock price needs to recover itself towards the upper level to show some bullish signal over the daily price chart. Meanwhile, volume change can be observed above average and showcases that buyers are trying to accumulate themselves in the day’s trading session. However, the support for AMC share price is situated at $4.00 and resistance on the other hand is at $5.70.
Will AMC Stock be Oversold or Return before 30 RSI?
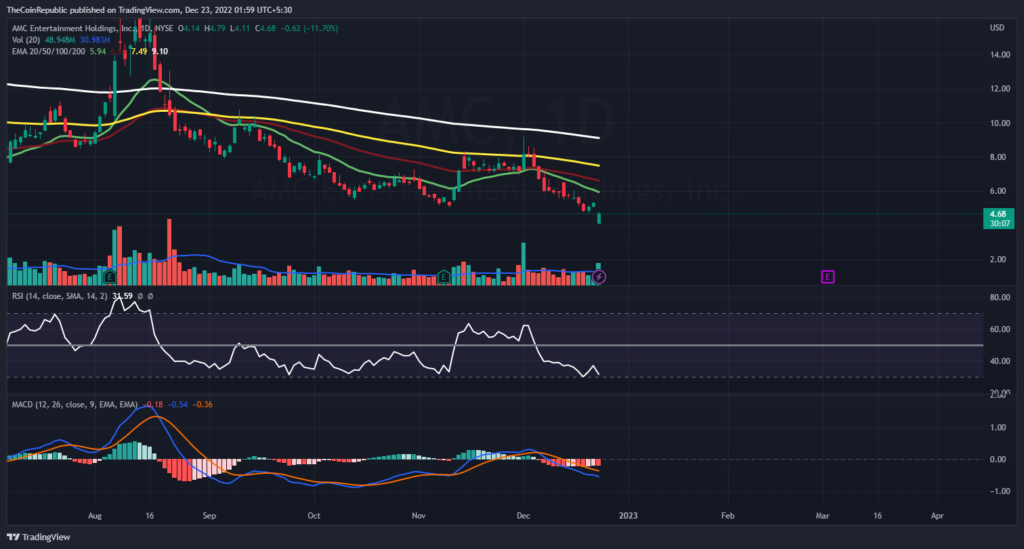
AMC stock price must surge back towards the recovery phase over the daily price chart. However, technical indicators show the downtrend momentum of AMC share price.
Relative Strength Index showcases the falling momentum of AMC stock. RSI is at 31 and AMC stock is about to enter the oversold territory. MACD exhibits the strong downtrend momentum of AMC share price over the daily price chart. The MACD line is below the signal line after a negative crossover. AMC shareholders need to wait for any directional change over the daily price chart.
Summary
AMC share price has been falling since August 2022 and slumped till 2021 lows, currently being priced at $4.70 losing around 11.42% of its market capitalization in the last 24-hour period. AMC share price needs to attract more buyers in order to retain its position at the upper levels over the daily price chart. However, the support for AMC share price is situated at $4.00 and resistance on the other hand is at $5.70. However, technical indicators show the downtrend momentum of AMC share price. The MACD line is below the signal line after a negative crossover. AMC shareholders need to wait for any directional change over the daily price chart.
Technical Levels
Support Levels: $4.00 and $3.50
Resistance Levels: $5.70 and $6.80
Disclaimer
The views and opinions stated by the author, or any people named in this article, are for informational ideas only, and they do not establish financial, investment, or other advice. Investing in or trading crypto assets comes with a risk of financial loss.
Steve Anderson is an Australian crypto enthusiast. He is a specialist in management and trading for over 5 years. Steve has worked as a crypto trader, he loves learning about decentralisation, understanding the true potential of the blockchain.


