
 Home
Home News
News

- Verizon stock price has been trying to surge above the $40.00 to register its breakout from the symmetrical triangle pattern.
- VZ stock price is trying to maintain itself above 20 and 50 EMA while striving to recover above 100 and 200-days Daily Moving Average.
- The American multinational telecommunications corporation Verizon Communications Inc., also known as Verizon, is a corporate member of the Dow Jones Industrial Average.
Verizon stock price (NYSE: VZ) has been slipping over the daily price chart since July 2022 but finally VZ stock is trying to surge after getting support at $35.00. Verizon stock price needs to attract buyers in order to surge above the upper trendline of the symmetrical triangle pattern over the daily time frame chart. Meanwhile, accumulation rate can be seen through volume change over the daily price chart. Volume change is above average showcasing the strong accumulation rate of VZ stock.

Verizon stock price is currently approximated at $38.10 and has dropped by 0.55% during the day’s trading session. Verizon share’s market capitalization is summed up at 160.035B and volume is at 3.014M.

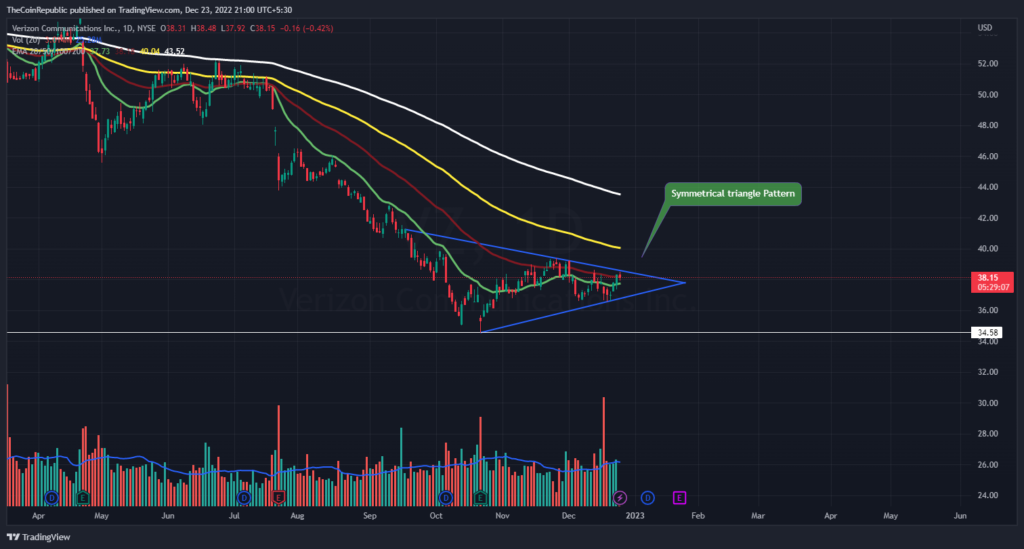
Verizon stock price has been trading inside the symmetrical triangle pattern over the daily price chart. VZ share price needs to maintain the current accumulation rate of VZ stock over the daily price chart. Meanwhile, volume also confirms the accumulation rate of buyers involved in the VZ share price. Some interesting levels for VZ to cover by the end of this week.
Will Verizon Stock Register its Breakout?
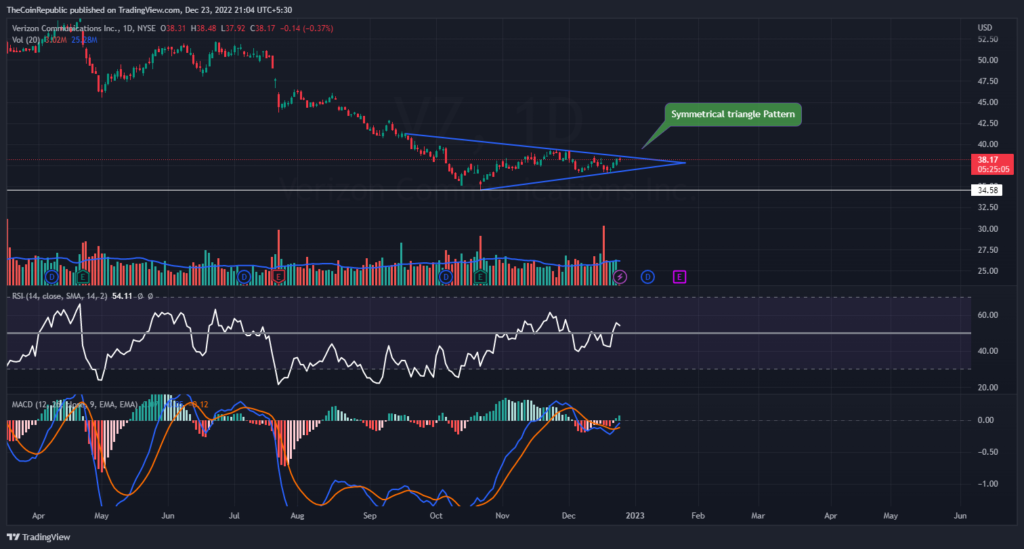
Verizon stock price needs to register its breakout from the symmetrical triangle pattern over the daily price chart. However, technical indicators are divergent over the price action of Verizon share price.
Relative Strength Index showcases the fall of VZ share during the day’s trading session. RSI is at 54 and is heading towards neutrality. MACD exhibits the uptrend momentum of Verizon share price. The MACD line is ahead of the signal line after a positive crossover. Investors in Verizon need to pay attention to technical indicators for VZ share price.
Summary
Verizon stock price (NYSE: VZ) has been slipping over the daily price chart since July 2022 but finally VZ stock is trying to surge after getting support at $35.00. Meanwhile, volume also confirms the accumulation rate of buyers involved in the VZ share price. However, technical indicators are divergent over the price action of Verizon share price. The MACD line is ahead of the signal line after a positive crossover.
Technical Levels
Support Levels: $36.50 and $34.50
Resistance Levels: $38.70 and $45.00
Disclaimer
The views and opinions stated by the author, or any people named in this article, are for informational ideas only, and they do not establish financial, investment, or other advice. Investing in or trading crypto assets comes with a risk of financial loss.

Andrew is a blockchain developer who developed his interest in cryptocurrencies while pursuing his post-graduation major in blockchain development. He is a keen observer of details and shares his passion for writing, along with coding. His backend knowledge about blockchain helps him give a unique perspective to his writing skills, and a reliable craft at explaining the concepts such as blockchain programming, languages and token minting. He also frequently shares technical details and performance indicators of ICOs and IDOs.


