
 Home
Home News
News

- Riot Stock price prediction showcases that the stock price has been descending through a falling parallel channel over the daily price chart.
- RIOT stock has dropped below 20, 50, 100 and 200-days Daily Moving Average.
- Demand and supply business works for RIOT stock price as the stock price has fallen below the demand zone over the daily price chart.
Riot stock price prediction suggests that the price has been declining through a descending parallel channel over the daily price chart. However, the accumulation rate must be increased for RIOT stock to reverse the trend from the demand zone. RIOT stock has dropped through an interesting pattern as from March 2022 the token has followed a declining streak and then surged through a recovery curve after getting support from $4.00. Now the RIOT share price has dipped below $4.00 demand zone and is now consolidating to reverse the current trend of the RIOT stock price.

Riot stock price is currently approximated at $3.68 and has dropped by 2.65% in the past 24-hour period. Now, RIOT share investors need to wait for Monday’s trading session for the stock price to showcase any directional change over the daily price chart.

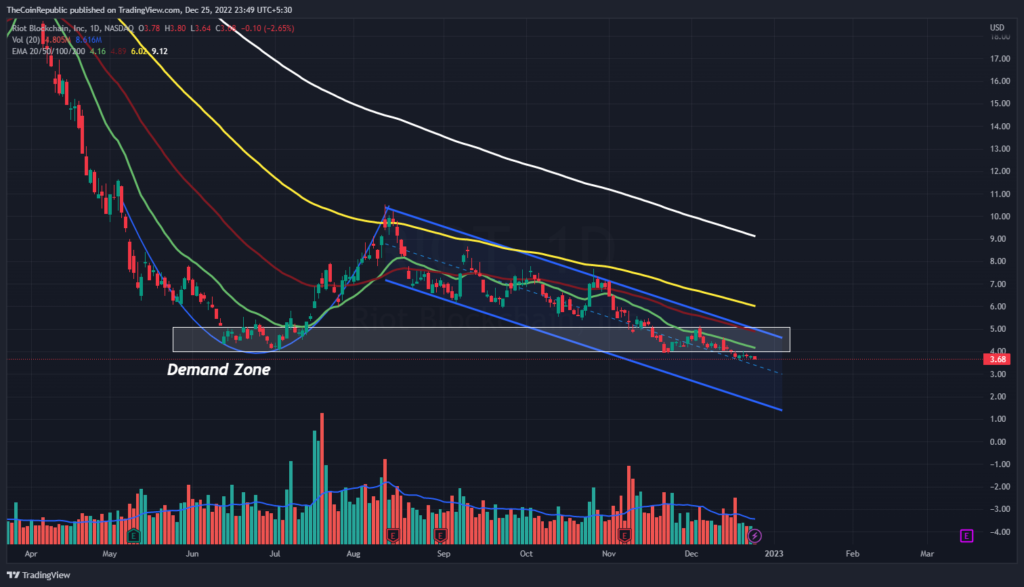
Riot stock price prediction suggests the token’s declining momentum over the daily price chart. Meanwhile, volume change can be seen below average and needs to grow for RIOT stock to gain stability over the daily time frame chart. However, Monday’s trading session may showcase some exclusive signals for the week’s trading sessions of RIOT stock price. However, RIOT stock has currently dropped below 20, 50, 100 and 200-days Daily Moving Average.
Will RIOT Stock Price be Oversold or Return back by the Opening?
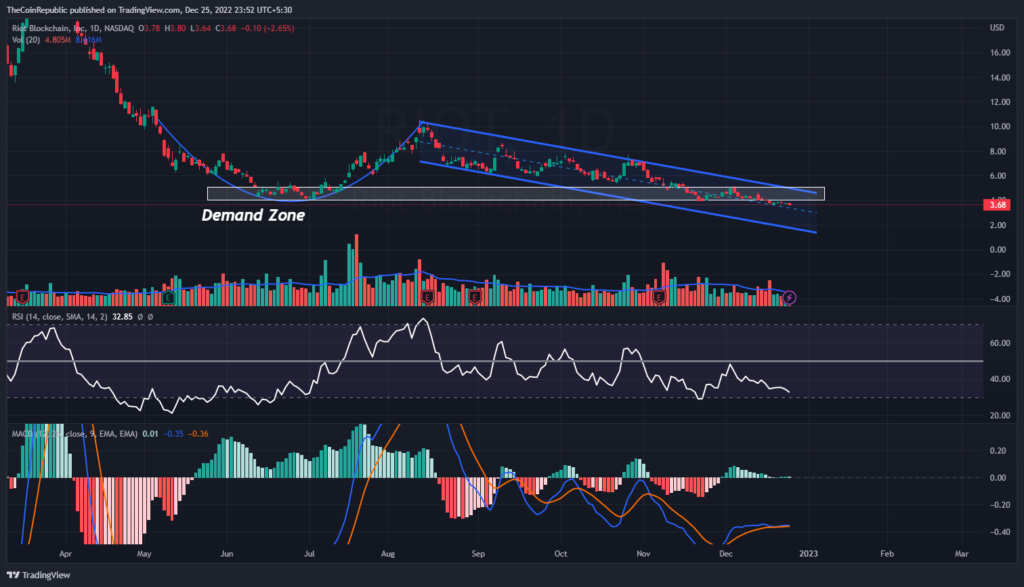
Technical indicators suggest that RIOT stock price is currently declining to be oversold over the daily chart. Relative Strength Index showcases the downtrend momentum of RIOT share. RSI is at 32 and is about to enter oversold territory if Monday’s trading session starts with a negative signal. MACD exhibits the sideways momentum of RIOT stock.
The MACD line is overlapping the signal line for showcasing the sideways momentum of RIOT stock over the daily price chart. RIOT investors need to wait for a gap up if possible for RIOT stock price to surge back towards its recovery phase.
Summary
Riot stock price prediction suggests that the price has been declining through a descending parallel channel over the daily price chart. However, the accumulation rate must be increased for RIOT stock to reverse the trend from the demand zone. However, Monday’s trading session may showcase some exclusive signals for the week’s trading sessions of RIOT stock price. Technical indicators suggest that RIOT stock price is currently declining to be oversold over the daily chart. RIOT investors need to wait for a gap up if possible for RIOT stock price to surge back towards its recovery phase.
Technical Levels
Support Levels: $3.50 and $3.00
Resistance Levels: $4.67 and $5.15
Disclaimer
The views and opinions stated by the author, or any people named in this article, are for informational ideas only, and they do not establish financial, investment, or other advice. Investing in or trading crypto assets comes with a risk of financial loss.

Andrew is a blockchain developer who developed his interest in cryptocurrencies while pursuing his post-graduation major in blockchain development. He is a keen observer of details and shares his passion for writing, along with coding. His backend knowledge about blockchain helps him give a unique perspective to his writing skills, and a reliable craft at explaining the concepts such as blockchain programming, languages and token minting. He also frequently shares technical details and performance indicators of ICOs and IDOs.


