
 Home
Home News
News
- XRP price prediction suggests that the token’s price has been declining and is currently at the verge of consolidation phase.
- XRP crypto has slipped below 20, 50, 100 and 2–days Daily Moving Average.
- Volume to market capitalization ratio is at 0.01653.
The daily price chart of the XRP cryptocurrency indicates the phases of token consolidation based on the XRP price prediction. XPR must navigate the XRP cryptocurrency’s roller coaster ride and wait for the token to emerge from the consolidation phase. The price of the XRP cryptocurrency must climb into the phase’s top range. To increase the bulls’ pace of accumulation during the intraday trading session, buyers must step forward in the interim.

The estimated price of XRP is $0.34 at the moment and has decreased by 1.66% over the intraday trading period. During the intraday trading session, trade volume climbed 0.55%. This shows the rate at which buyers accumulated throughout the intraday trading session. At 0.01653, the volume to market cap ratio.

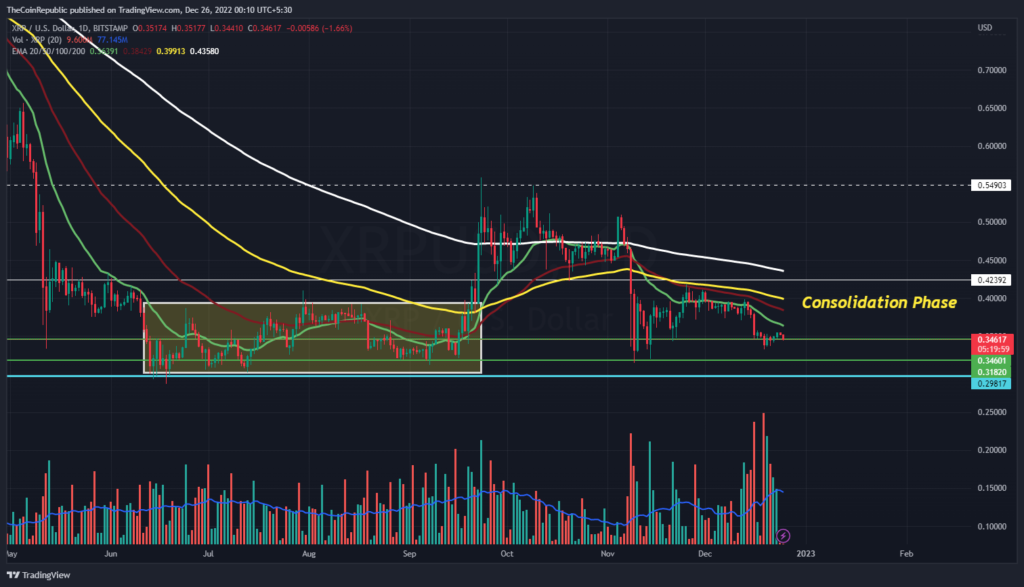
In order to mark the token’s recovery phase on the daily price chart, the XRP price needs to surge towards the upper range and must rise over $40.00. The XRP cryptocurrency successor was launched in October 2022, and it is now fighting to hold on to its lower level while receiving support close to the lower level of the consolidation phase. For XRP cryptocurrency, the volume change needs to increase since it is currently below average.
What do Technical Indicators Suggest about XRP Price?
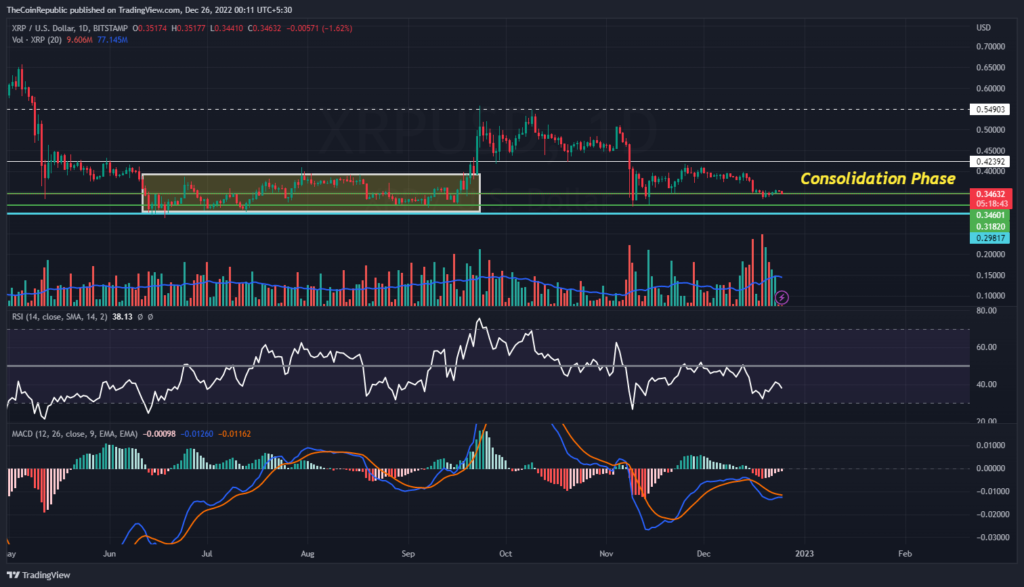
The price of XRP has been maintained around the lower end of the consolidation phase and is currently attempting to buck the trend. Technical indicators point to the momentum of the token’s downward trend on the daily price chart.
Relative Strength Index showcases the XRP price is slumping below the lower price of the consolidation phase. RSI is at 38 and is trying to sustain below neutrality. MACD exhibits downtrend momentum of XRP price. The MACD line must surge towards the signal line for a positive crossover.
Summary
The daily price chart of the XRP cryptocurrency indicates the phases of token consolidation based on the XRP price prediction. XPR must navigate the XRP cryptocurrency’s roller coaster ride and wait for the token to emerge from the consolidation phase. At 0.01653, the volume to market cap ratio. Technical indicators point to the momentum of the token’s downward trend on the daily price chart. The MACD line must surge towards the signal line for a positive crossover.
Technical Levels
Support Levels: $0.32 and $0.30
Resistance Levels: $0.40 and $0.42
Disclaimer
The views and opinions stated by the author, or any people named in this article, are for informational ideas only, and they do not establish financial, investment, or other advice. Investing in or trading crypto assets comes with a risk of financial loss.
Steve Anderson is an Australian crypto enthusiast. He is a specialist in management and trading for over 5 years. Steve has worked as a crypto trader, he loves learning about decentralisation, understanding the true potential of the blockchain.


