
 Home
Home News
News
- BCH price formed a bullish candle from its support level of $100 and is likely to approach 50 day ema soon.
- MACD had generated positive crossover and the RSI at 45 attempting to reach neutral level.
Bitcoin Cash is trading with mild bearish cues but prices were showing initial signs of short term trend reversal by forming higher high bullish candles from the support zone of $100. Currently, BCH/USDT is trading at $102.8 with the intraday loss of 0.58% and 24 hour volume to market ratio stood at 0.0465
Should investors accumulate BCH ?
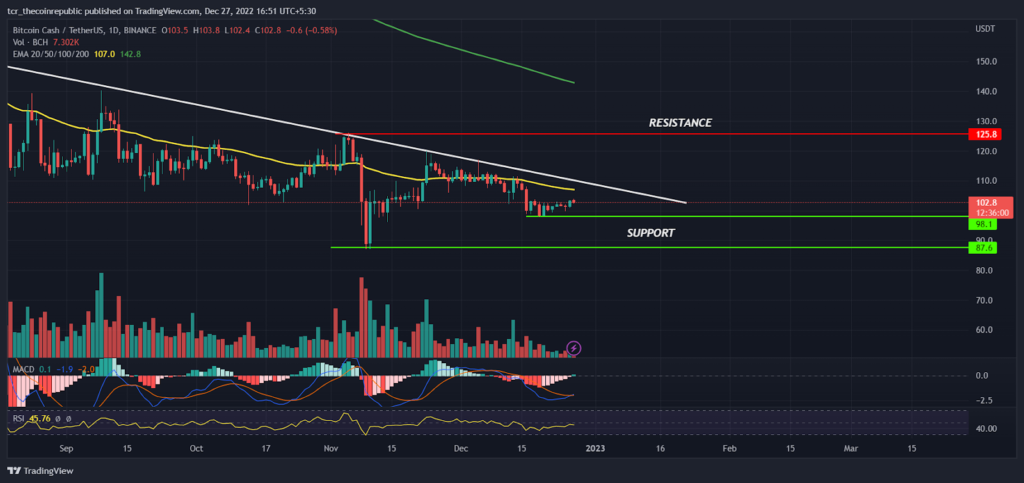
On a daily time frame, BCH prices had been quite stable as compared to its peers and had succeeded to defend the $100 level but sellers were very aggressive on higher levels and it will be not easy for buyers to hold $100 in coming months. From the past couple of months, prices have been trading in the wide range between $100 to $140 with a hope of upside breakout but sellers were not let the price to trade in the favor of bulls and kept the prices below 50 day ema (yellow) on a continuous basis.
Recently, due to FTX collapse, BCH prices broke down its lower range support at $100 and hit a yearly low at $87.00 but surprisingly, buyers showed interest at lower levels and helped the prices to bounce back to its previous consolidation zone. The 200 day ema (green) sloping down indicates trend to remain weak on a positional basis and The 50 day ema (yellow) at $107 will act as an immediate hurdle for bulls followed by the next hurdle will be a falling trending and $125 level. On a lower side, $98 and $87 will act as a demand zone for BCH investors. The MACD has generated a positive crossover indicating a price may witness bullish momentum in coming days, similarly the RSI at 45 denotes price may enter neutral level soon.
Supertrend generated BUY signal will it be sustainable ?
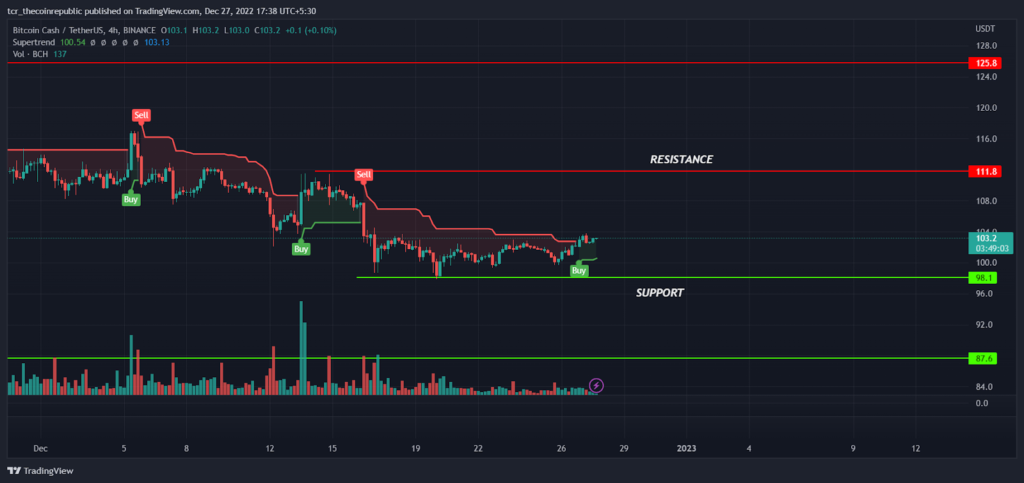
On a lower time frame, BCH investors are trying to reverse the short term trend in the favor of bulls but due to mild negative sentiment in crypto industry it will be difficult for buyers to sustain above higher levels. From the past few days, BCH had been trading in the tight range between $98 to $104 and likely to breakout in either direction soon. Recently, The supertrend has generated a buy signal indicating the short term trend is reversing in the favor of bulls and bullishness may continue for some more time.
Summary
BCH prices are showing initial signs of short term trend reversal by forming higher high bullish candles from the support zone of $100. However, sellers may try to reject the prices from the 50 day ema at $107 to prove its dominance on the higher levels. As of now, aggressive traders might look for buying opportunities for the target of $111 and above levels by keeping $98 as SL and if prices slipped below $98 sellers may drag the prices further down towards $87 and below levels.
Technical levels
Resistance levels : $111.8 and $125.8
Support levels : $98.1 and $87.6
Disclaimer
The views and opinions stated by the author, or any people named in this article, are for informational ideas only, and they do not establish financial, investment, or other advice. Investing in or trading crypto assets comes with a risk of financial loss.

Nancy J. Allen is a crypto enthusiast, with a major in macroeconomics and minor in business statistics. She believes that cryptocurrencies inspire people to be their own banks, and step aside from traditional monetary exchange systems. She is also intrigued by blockchain technology and its functioning. She frequently researches, and posts content on the top altcoins, their theoretical working principles and technical price predictions.


