
 Home
Home News
News
- Nexo price rejected 50 day ema and may test yearly lows again.
- The MACD had generated positive crossover but lacked momentum on the higher side whereas RSI at 41 sloping down may test oversold levels.
NEXO Price has been trading with a mild bearish bias and genuine buyers seem to be reluctant to build long positions at lower levels but speculative moves may trigger a relief rally soon. Currently, NEXO/USDT is trading at $0.636 with the intraday loss of 2.15% and 24 hour volume to market ratio stood at 0.0079
Relief rally from yearly lows ?
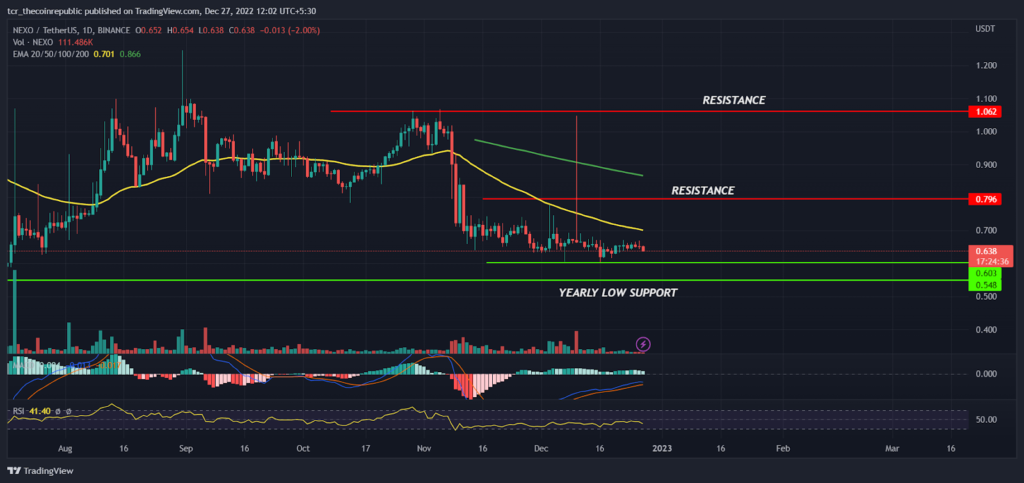
On a daily time frame, NEXO price chart has been in a downtrend and bears are continuously dominating on the higher levels. In the mid of July, some aggressive buyers entered the market at $0.548 levels and pushed the price higher with great momentum and hit a high at $1.245. Later, prices consolidated for the couple of months in the wide range between $0.796 to $1.062 with the hope of higher range breakout but unfortunately bears took control on higher levels and succeed to drag the prices below the lower range support of $0.796 which triggered the negative sentiment for the NEXO investors.
The 200 day ema (green) sloping down indicates a trend to remain weak on a positional basis while the 50 day ema (yellow) at $0.701 will act as an immediate hurdle for bulls in coming days followed by next will at $0.796. On a lower side $0.603 will act as an immediate support and buyers might try to reverse the trend in the favor of bulls. The MACD had generated positive crossover and slowly approaching towards zero line whereas the RSI at 41 sloping down may enter oversold level soon.
Will the bulls be able to defend the recent lows ?
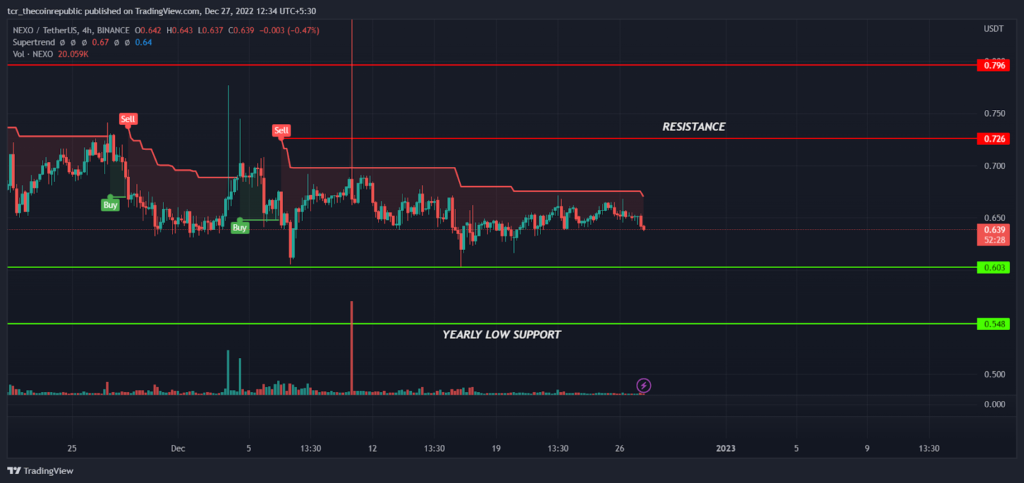
On a lower time frame, NEXO price chart looks stable and has been consolidating in the range between $0.603 to $0.726 with the mild bearish bias and likely to expand in either direction soon. The super trend indicator had generated a sell signal and a resistance line stood flat indicating a short term trend to remain on the bear’s grip. However, if bulls succeed to trade above $0.726 we may see a short term bullish trend reversal.
Summary
NEXO prices had attempted to sustain higher levels but due to negative sentiment in the whole crypto industry sellers dominated the Nexo prices and kept the prices in bear’s grip. As per technical analysis, prices still do not show any strong signs of upside trend reversal so, it’s better to avoid buying NEXO at current levels.
Technical levels
Resistance levels : $0.726 and $0.796
Support levels : $0.603 and $0.548
Disclaimer
The views and opinions stated by the author, or any people named in this article, are for informational ideas only, and they do not establish financial, investment, or other advice. Investing in or trading crypto assets comes with a risk of financial loss.

With a background in journalism, Ritika Sharma has worked with many reputed media firms focusing on general news such as politics and crime. She joined The Coin Republic as a reporter for crypto, and found a great passion for cryptocurrency, Web3, NFTs and other digital assets. She spends a lot of time researching and delving deeper into these concepts around the clock, and is a strong advocate for women in STEM.


