
 Home
Home News
News
- Snapchat (SNAP) share price appears to be extremely bearish in December.
- Buyers saw 17% loss in the last 29 days.
- The daily RSI indicator is trading flat above the oversold zone.
During the Santa rally, several US equities outperformed, while others fell. Snap Inc., a camera and social media firm located in the United States, is shutting down this month. This downturn occurred when the digital asset’s price fell by around 28% following the Q3 results report.
For long-term investing, the NYSE:Snapchat share price appears to be low. However, Wall Street’s major indexes finished down on Wednesday, with the Nasdaq reaching a 2022 low as investors prepared for a 2023 with conflicting economic data, growing COVID cases in China, and geopolitical concerns. Despite a dismal worldwide market close, the SNAP stock price ended the day in the green, up 0.12%.
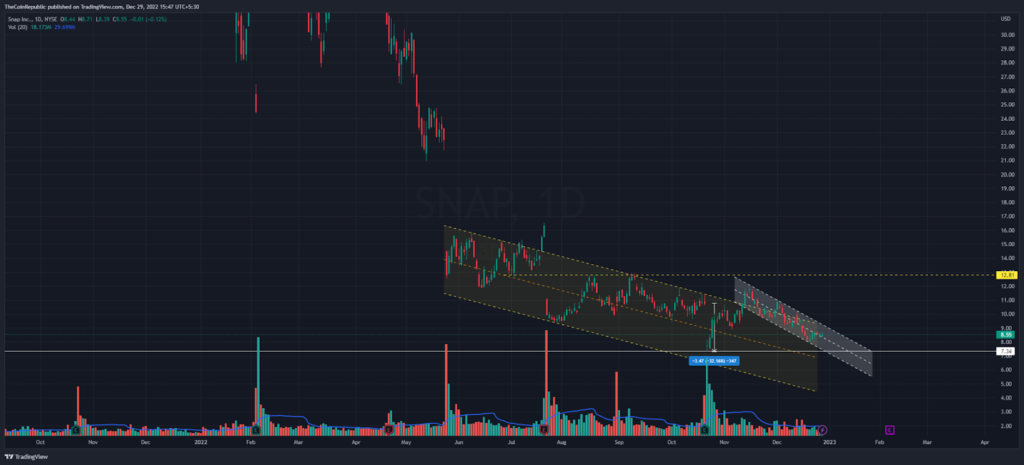
Speculators saw extreme volatility in the months of October and November as the monthly price candles formed two consecutive long-legged Doji candles. However, buyers are active in the market as there is bullish momentum from last two days. In the December 28 letter, buyers successfully closed the daily candle at the $8.55 level.
Amid the sell-off on the higher trendline, the bears are heading towards the yearly low of $7.33. If the buyers reverse the bearish trend at this point, the price structure could possibly reflect a double bottom pattern on the higher time frames. Meanwhile, buyers have lost the crucial $10 defense level, which turned into immediate resistance after it was broken.
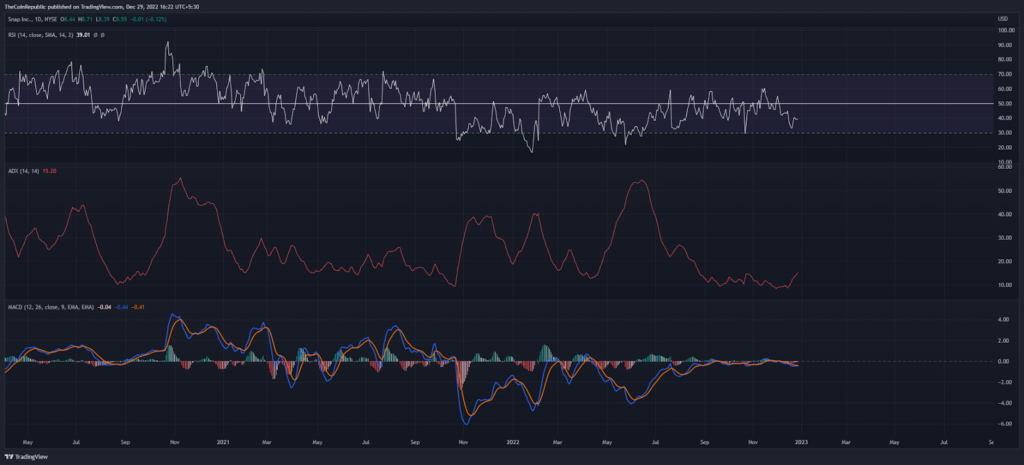
In terms of daily price scale, the Average Directional Trend (ADX) started extending higher showing aggressive selling in SNAP stock price. Amidst the downtrend, the RSI indicator is trading flat above the oversold zone. Lastly, the MACD indicators support the negative sentiment in the coming sessions.
Conclusion
Heavy selling pressure in NYSE: SNAP stock may hit a yearly low. Technical indicators and price structure suggest further downside in price despite marginal correction.
Support level – $7.3 and $5.0
Resistance level – $10 and $20
Disclaimer
The views and opinions stated by the author, or any people named in this article, are for informational ideas only, and they do not establish financial, investment, or other advice. Investing in or trading crypto assets comes with a risk of financial loss.

Andrew is a blockchain developer who developed his interest in cryptocurrencies while pursuing his post-graduation major in blockchain development. He is a keen observer of details and shares his passion for writing, along with coding. His backend knowledge about blockchain helps him give a unique perspective to his writing skills, and a reliable craft at explaining the concepts such as blockchain programming, languages and token minting. He also frequently shares technical details and performance indicators of ICOs and IDOs.


