
 Home
Home News
News

- Ethereum (ETH) is registering a price recovery lower on the hourly chart.
- The buyers are barely keeping ETH price above the $1185 support.
- Trading volume fell 11% to $4.01 billion.
Another favorite cryptocurrency, Ethereum, is attempting a reverse move. Market sellers often failed to push Ethereum price below its previous swings. Meanwhile, the buyers defended themselves three times in the last few days.

For the short-term outlook, the $1205 mark shows a potential to act as a resistance area. Thus at the time of writing the Ethereum price is trading around the $1192 mark against USDT. Despite the hourly price recovery, the daily price candle is still showing red with a loss of 0.66%.

Ethereum Price Prediction on Hourly Chart
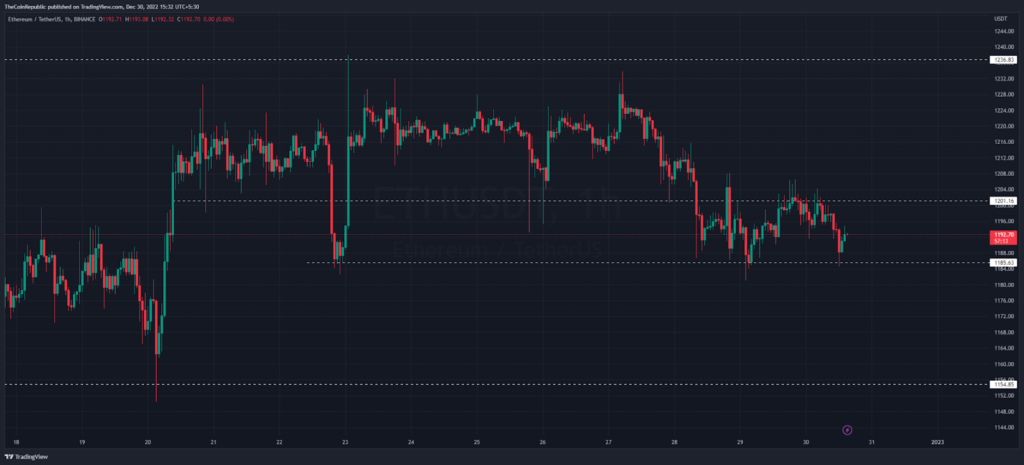
In the hourly chart, Ethereum Price (ETH) is remaining into the narrow horizontal range between $1185 to $1205 support to resistance. Meanwhile, support line likely provide bullish opportunities soon. On the other hand, if this support level breaks then $1155 will be the next reliable demand zone.
Amid roller-coaster ride, market capitalization recorded at $145.9 Billion. Speculators are struggling due to low volatility in market because volume decreases gradually. Notably Trading volume plunged 11% at $4.01 Billion overnight. Furthermore, the EThereum price concerning the Bitcoin pair is trading sideways at 0.07218 Satoshis.
Ethereum Price Prediction on Daily Basis
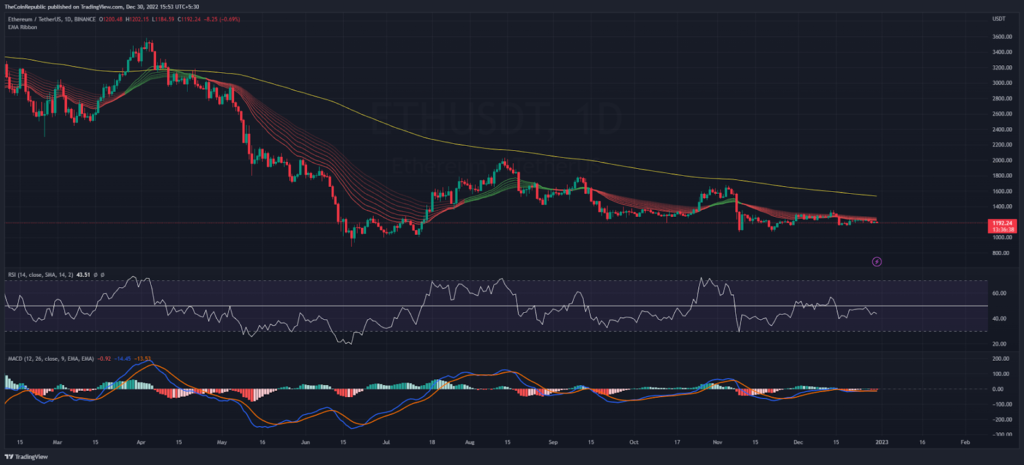
If Ethereum price breaks out from the weekly low, buyers could witness another decline in price. After all, the bears have dominated the ETH price action since early November. Now buyers must reverse the ongoing decline to rid themselves of it.
The crypto EMA ribbon looks below the red moving lines of the indicator. Where the 200 EMA line has become a red zone for selling. With the 43 mark present, the RSI indicator appears flat, a visual indication of a sideways trend. In conclusion, the MACD does not suggest any bullish opportunities for ETH.
Conclusion
Ethereum price (ETH) is trading near the resistance, the bears might make another selling attempt at this point. But the hourly price recovery could fuel upside momentum.
Support level – $1150 and $1100
Resistance level – $1300 and $1500
Disclaimer
The views and opinions stated by the author, or any people named in this article, are for informational ideas only, and they do not establish financial, investment, or other advice. Investing in or trading crypto assets comes with a risk of financial loss.

Andrew is a blockchain developer who developed his interest in cryptocurrencies while pursuing his post-graduation major in blockchain development. He is a keen observer of details and shares his passion for writing, along with coding. His backend knowledge about blockchain helps him give a unique perspective to his writing skills, and a reliable craft at explaining the concepts such as blockchain programming, languages and token minting. He also frequently shares technical details and performance indicators of ICOs and IDOs.


