
 Home
Home News
News
- LTC price slipped below 50 and 200 day ema which will act as a hurdle for LTC traders.
- LTC bulls were trying to keep the price above the important support level of $60.00
LTC prices are trading with mild bearish cues and likely to face resistance at 50 day ema and 200 day ema in coming few sessions. Currently,LTC/USDT is trading at $66.58 with the intraday loss of 0.12% and 24 hour volume to market ratio stood at 0.069
Will the LTC price retest $60 again ?
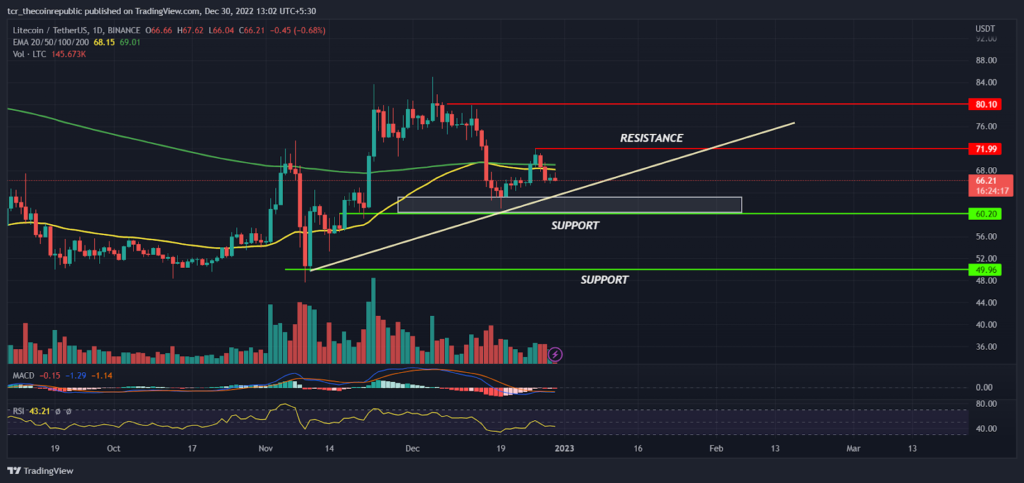
On a daily time frame, LTC prices are attempting to reverse the positional trend in the favor of bulls. In November, LTC prices breakout its 6 months consolidation zone with a higher volume and created hope for its bullish investors but due to FTX collapse, massive selling triggers all over the industry and LTC lost its previous gain. Later, LTC bulls immediately bounced back from the lows at $47.60 and shot up almost 65% from the lows indicating genuine buyers are active at lower levels.
After a little bit of consolidation in the higher zone between $70 to $80 LTC again slipped below 200 day and 50 day ema which may act as immediate resistance in
in the coming days followed by the next hurdle $70.00 and $80.00. On a lower side, LTC prices may find stability near the support zone at $60.00 levels. The MACD had generated negative crossover denotes prices may trade with mild bearishness whereas RSI at 43 reversing upside may enter the neutral zone.
Will the trend reverse downside again ?
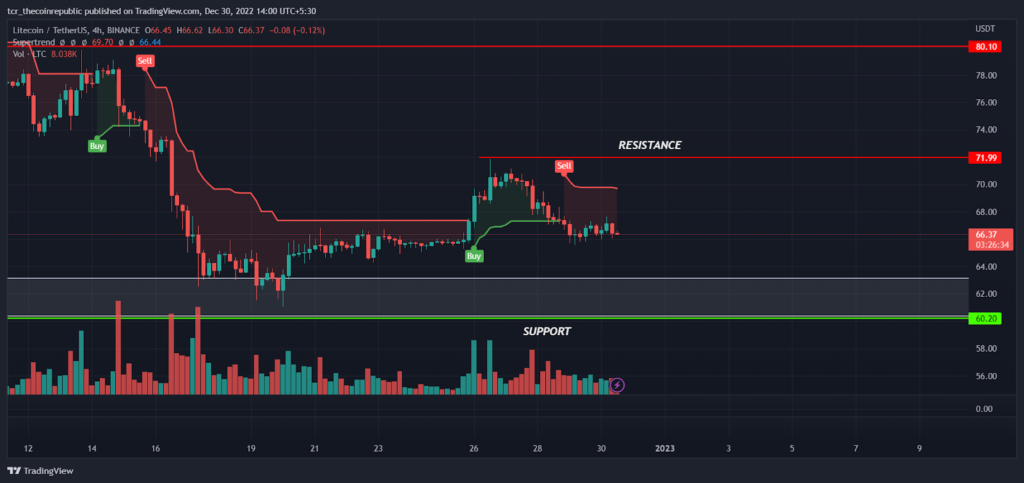
On a lower time frame, LTC prices are trading in the range between $60.00 to $70.00 and likely to see upside trend reversal from the support levels. The supertrend indicator had generated a sell signal indicating the short term trend may remain in a bear grip but if bulls succeed to trade above $70.00 we may see further upside movement towards $80.00 and above levels.
Summary
Litecoin prices had strong recovery from the recent lows while forming a bullish hammer candle from the support level of $60 indicates responsive buyers are active at lower levels. As per technical analysis, prices are mild bearish but it will be risky to create a short position near the support levels. So, aggressive traders might look for buying opportunities near to $60.00 levels for the target of $71 and above by keeping $55 as SL. However, if prices slipped below $60.00, sellers will drag the prices further down towards 50 levels.
Technical levels
Resistance levels : $71.00 and $80.00
Support levels : $60.00 and $50.00
Disclaimer
The views and opinions stated by the author, or any people named in this article, are for informational ideas only, and they do not establish financial, investment, or other advice. Investing in or trading crypto assets comes with a risk of financial loss.

Nancy J. Allen is a crypto enthusiast, with a major in macroeconomics and minor in business statistics. She believes that cryptocurrencies inspire people to be their own banks, and step aside from traditional monetary exchange systems. She is also intrigued by blockchain technology and its functioning. She frequently researches, and posts content on the top altcoins, their theoretical working principles and technical price predictions.


