
 Home
Home News
News
- Aptos crypto price is up by 24% from the recent lows and forming higher high candles
- APT token prices bounced back from the lows at $3.0660 and might approach 50 day in coming days
APT crypto price is trading with mild bullish cues and bulls were trying to regain the buyers confidence back while forming higher highs candles. As per coinglass, In the last 12 hours, APT long and short ratio stood at 0.97 denotes a balance between the sentiment of buyers and sellers. Currently, APT/USDT is trading at $3.7608 with the intraday gains of 0.03% and 24 hour volume to market cap ratio stood at 0.2615
Good time to accumulate APT ?
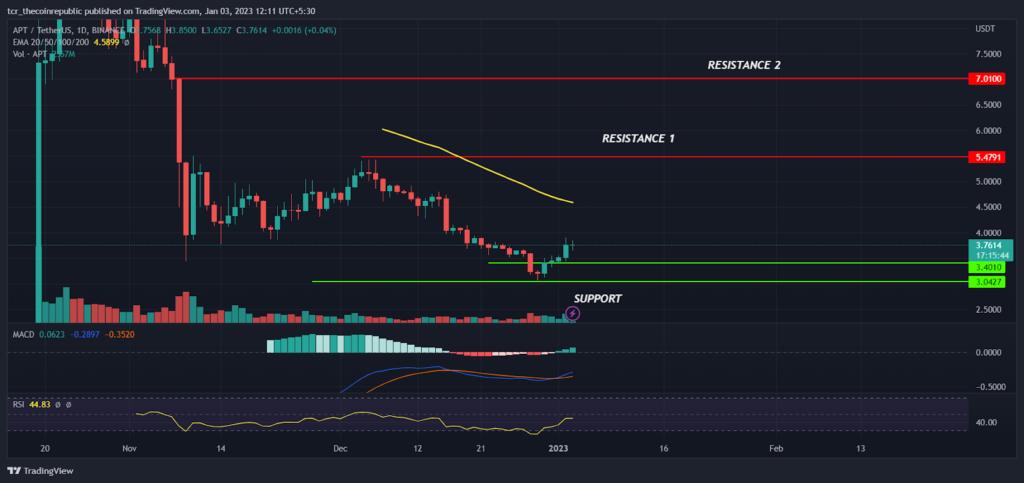
On a daily time frame, APT crypto prices had also become a victim of FTX collapse and the prices plunged over 50% in a short span of time but slowly and steadily prices seem to be forming a base in the range between $3.000 and $3.500 and showing some initial signs of short term upside reversal. Recently, APT took support at $3.0660 and formed a bullish hammer candle indicating buyers presence at lower levels. Later, prices recovered approx 24% while forming higher high candles.
The 50 day EMA (yellow) at $4.5897 will act as an immediate hurdle in coming days followed by next at $5.4791. On the lower side $3.0427 will act as a savior for bulls. As of now APT prices are at the beginning stage of upside reversal so, investors should wait for further price confirmation before accumulating the APT token. The MACD had generated positive crossover and the RSI at 45 indicates prices may trade with the bullish bias in coming sessions.
Is the Supertrend buy signal trustworthy or not ?
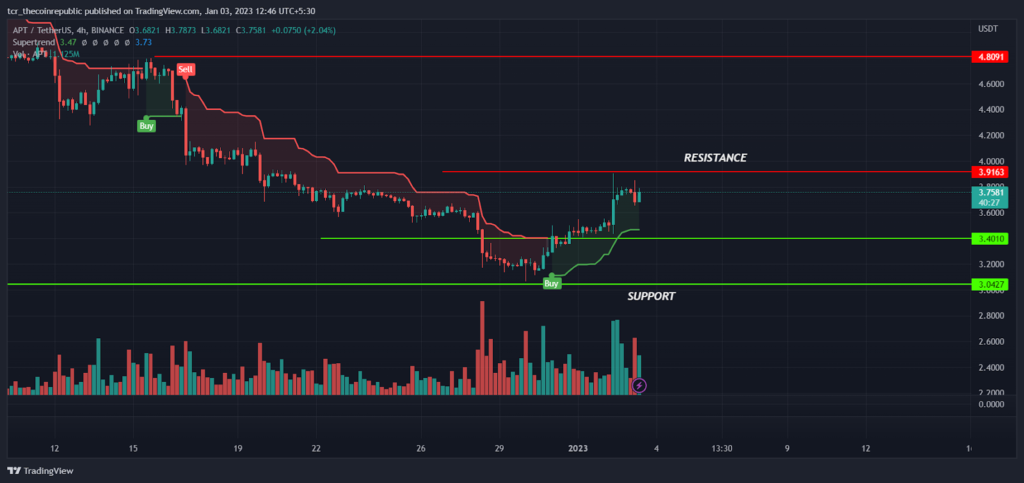
On a lower time frame, APT prices are slipping down while forming lower swings indicates bear’s dominance on higher levels but recently bulls are attempting to break the chain of downside movement and showing some initial signs of upside trend reversal. The super trend indicator has generated a buy signal and the support line (green) is trailing higher indicating the short term trend may continue in the upside direction. However if prices slipped below $3.4010, the upside reversal will be doubtful.
Summary
APT prices are showing some initial signs of reversal while forming higher high candle indicates buyers presence at lower levels. As per technical analysis, bulls are trying to dominate the prices at higher zones but the confirmation is still awaited. So, it’s better to avoid accumulating APT at current levels. However if bulls are able to sustain above $4.000 we may see further upside movement towards $7.000 and above levels.
Technical levels
Resistance levels : $4.8091 and $5.4791
Support levels : $3.0427 and $2.5000
Disclaimer
The views and opinions stated by the author, or any people named in this article, are for informational ideas only, and they do not establish financial, investment, or other advice. Investing in or trading crypto assets comes with a risk of financial loss.

Nancy J. Allen is a crypto enthusiast, with a major in macroeconomics and minor in business statistics. She believes that cryptocurrencies inspire people to be their own banks, and step aside from traditional monetary exchange systems. She is also intrigued by blockchain technology and its functioning. She frequently researches, and posts content on the top altcoins, their theoretical working principles and technical price predictions.


