
 Home
Home News
News
- Rivian stock price rejected 50 day EMA and formed a lower lows candles
- NASDAQ : RIVN stock price down by 40% on monthly basis
- Rivian prices broke down 52 weeks lows at $19.25
Rivian Stock price is trading with bearish cues and bears are continuing its dominance on higher levels. Previous few sessions were a nightmare for Rivian stock investors due to massive selloff from the $32.00 levels which had eroded approx 40% of market capitalization. Currently, NASDAQ : RIVN stock price is trading at $17.16 with the intraday loss of 6.89%.
Should investors catch the falling knife ?
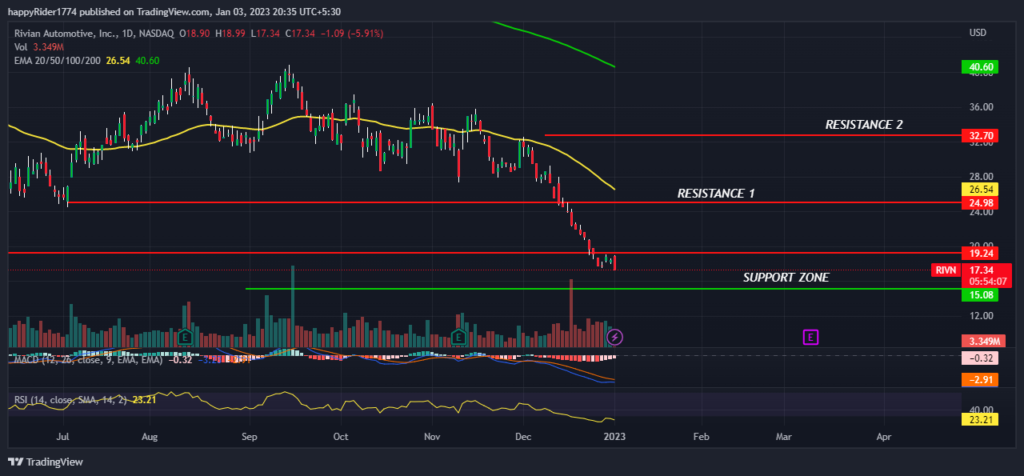
On a daily time frame, NASDAQ : RIVN stock prices are in a strong downtrend and forming lower lows candles on a continuous basis indicates bears dominance on higher levels. From the past 6 months RIVN prices are trading sideways in the range between $28.00 to $40.00 with a bearish bias and recently bears succeeded to break down the lower range support level at $28.00 which triggered more selloff and the stock plunged 40% on a monthly basis.
The 200 day EMA (green) sloping down indicates a trend to remain weak on a positional basis and the 50 day EMA (yellow) at $26.00 will act as a strong hurdle zone in coming days if any relief rally triggers from the lower levels. As of now, prices seem to be oversold and are expected to trade in the consolidation zone between $15.00 to $25.00 in the coming months. On the lower side $15.00 might act as a meaningful support for bulls, However if prices slipped below $15, bears may try to drag the prices down towards $10.00 levels.
The deep red volume bars in the favor of sellers denote that some institutional investors have liquidated their positions at higher levels. The MACD had generated negative crossover denotes prices might remain in bear grip whereas the RSI at 23 (oversold) territory indicates bulls may attempt to trigger a relief rally in coming days. So, as per analysis of the daily time frame chart, investors should avoid creating any buy positions in the RIVN stock at lower levels.
Summary
Rivian stock price had lost 40% on monthly basis indicates strong bears are active on higher levels and prices action doesn’t show any signs of reversal. As per technical indicators prices are expected to remain in a bear grip but a minor short covering rally may trigger in coming days. However, If prices slipped below $15.00 bears may try to drag the prices further down towards $10.00 and below levels.
Technical levels
Resistance levels : $25.00 and $32.70
Support levels : $15.00 and $12.50
Disclaimer
The views and opinions stated by the author, or any people named in this article, are for informational ideas only, and they do not establish financial, investment, or other advice. Investing in or trading crypto assets comes with a risk of financial loss.

With a background in journalism, Ritika Sharma has worked with many reputed media firms focusing on general news such as politics and crime. She joined The Coin Republic as a reporter for crypto, and found a great passion for cryptocurrency, Web3, NFTs and other digital assets. She spends a lot of time researching and delving deeper into these concepts around the clock, and is a strong advocate for women in STEM.


