BSV price currently trades at $42.70 with an intraday gain of 0.70%.
Bitcoin SV price is willing to register fresh swings above the $45 mark. The near-term gains from the consecutive last 3 days indicate the strength and signals that bulls are regaining the muscles. Meanwhile, price respects its lower trendline and pulls back exactly from the price of $41.If price breaks the lower trendline, then a sharp fall can be noticed.
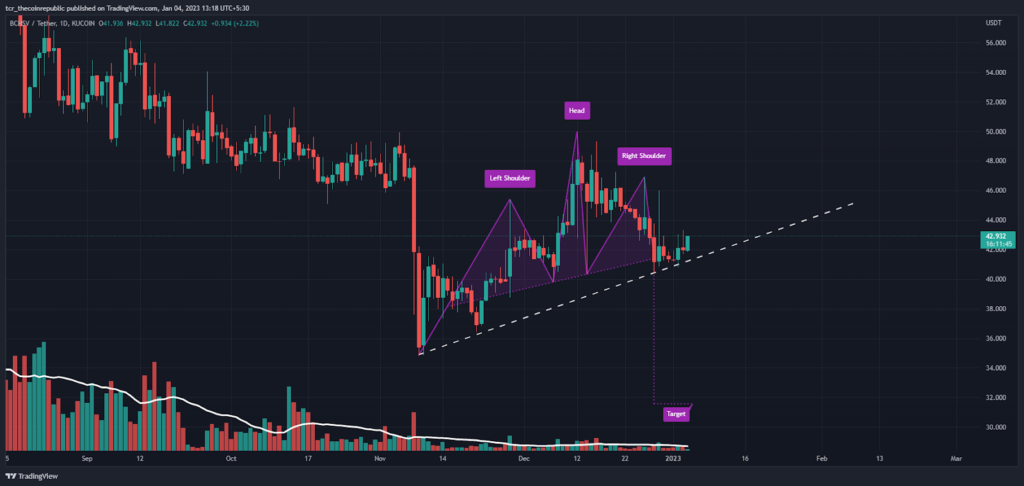
Last month, BSV hit a high near the $46 range but faced multiple rejections. Moreover, a bearish setup known as the head and shoulders pattern formed on chart signalling that if price goes below $41, then leads to more fall in the upcoming sessions.
Daily chart showing war between buyers and sellers

On the daily chart, BSV looks good with the recent pullback from the lower levels. On the other hand, bearish alerts are also given by head and shoulders pattern. Investors should keep an eye on which side the coin is going through for fresh buying or selling. Though, it holds the strength, behalf of losing the momentum, which is a good sign.
However, BSV price now rejects from its 50 days EMA and trades below its 20 days EMA. Despite the market slowdown, the trend is positive from the last 2 months and continues to make higher highs and higher lows.
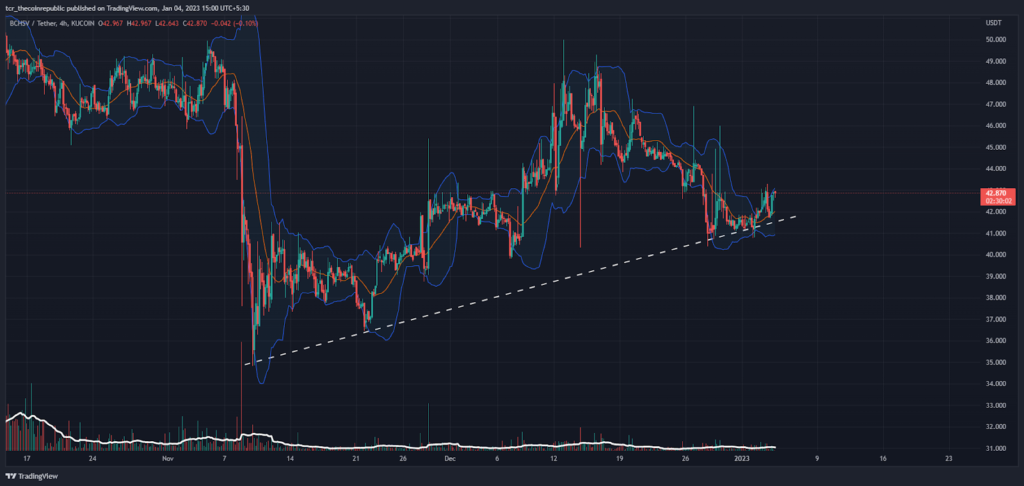
Short term Chart In a Congestion Zone

On the 4 hour chart. BSV price trades near the upper range of bollinger band and faces a barrier at $45. If the price succeeds to sustains above $45, then trend brings more positivity into it. Meanwhile, BSV trades inside the congestion range of $41- $44, beyond that trajectory will carry towards $50. If the price breaks the lower trendline, then it will retest its immediate support of $39.
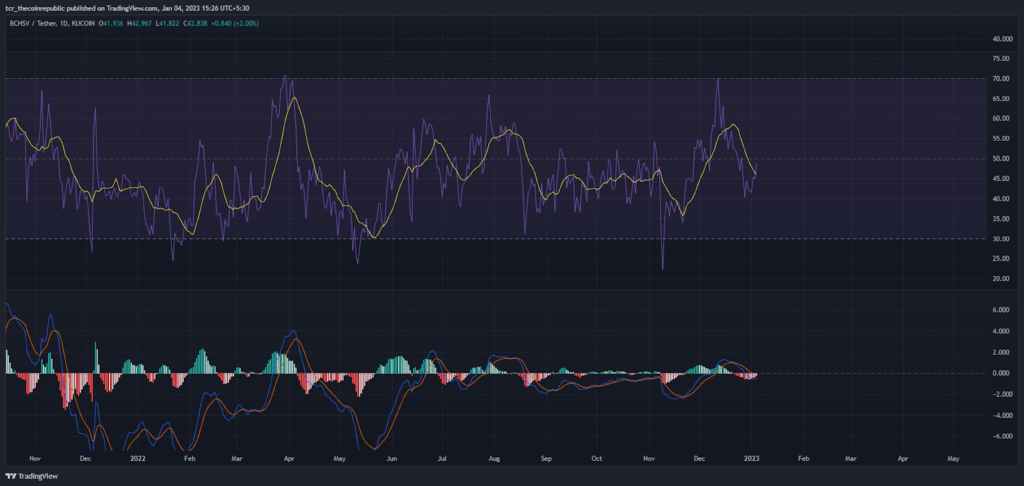
What RSI and MACD says?

RSI ( neutral): The relative strength index suggests an unbiased point of view, as it was near 50, so we can expect a swing on either side.
MACD ( Bearish ): The MACD has shown bearish cues from the past few days, but recently it intends to switch the trend and is looking for a crossover.
Conclusion:
Bitcoin SV price was facing multiple time rejections in the recent sessions, which tells bears firmly possess their grips and don’t want to forfeit. Moreover, the setup reveals bearishness, but the price sustains near the support, showing buyers are still involved and gradually creating longs that retain the coin price.
Technical Levels:
Support – $35
Resistance – $50
Disclaimer
The views and opinions stated by the author, or any people named in this article, are for informational ideas only, and they do not establish financial, investment, or other advice. Investing in or trading crypto assets comes with a risk of financial loss.

Andrew is a blockchain developer who developed his interest in cryptocurrencies while pursuing his post-graduation major in blockchain development. He is a keen observer of details and shares his passion for writing, along with coding. His backend knowledge about blockchain helps him give a unique perspective to his writing skills, and a reliable craft at explaining the concepts such as blockchain programming, languages and token minting. He also frequently shares technical details and performance indicators of ICOs and IDOs.


 Home
Home News
News


