
 Home
Home News
News
- Litecoin price is performing better after rallying in mid-December.
- Buyers are keeping LTC price above the all-important exponential moving averages.
- LTC bulls are recording the third weekly bullish candle this week.
So far, Litecoin looks to be a solid investment in the turbulent cryptocurrency industry. Recently, crypto supporters met on Twitter to discuss Litecoin developments. According to the latest update, Litecoin is the second most transacted cryptocurrency on Bitpay, the world’s largest crypto payment processor. This tweet led swing traders to adopt a positive short-term stance.

Buyers are looking bullish on Litecoin after its weekly correction. Meanwhile Litecoin price against the USDT bids at $76.08 mark at the time of publishing. Recent Litcoin’s twitter update pushed asset price upwards by 3.64% overnight.

Litecoin on Weekly Chart
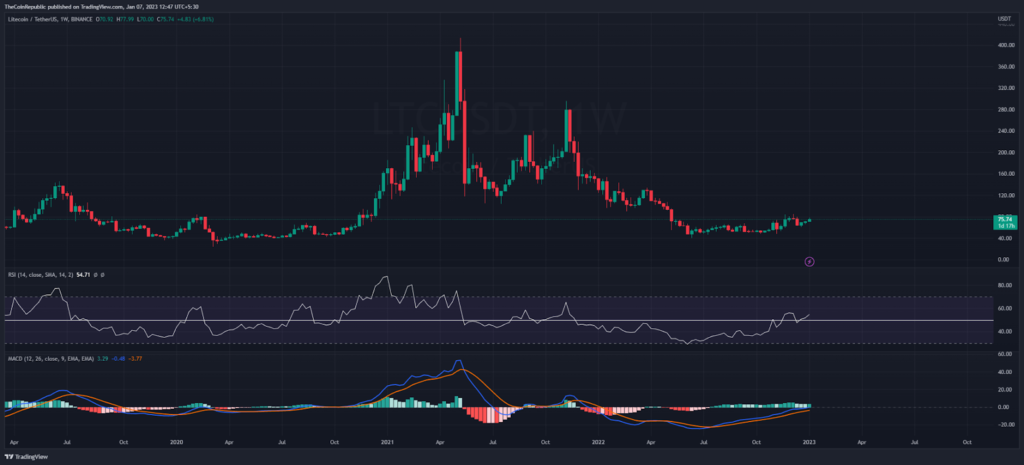
On the weekly graph, the accumulation on the downside has led to a bullish rally in the price of Litecoin. Thus LTC bulls are registering their third weekly bullish candle this week, with a gain of 7.42% so far. Meanwhile, the weekly RSI remains above the semi-line while the MACD is about to move above the neutral zone soon.
Litecoin is the only crypto currency under the top 15 to observe an uptrend in January. However the crypto market also gradually turns positive as the total crypto market capitalization increased by 1.23% over the previous day.
Buyers Struggle on Daily Price Chart
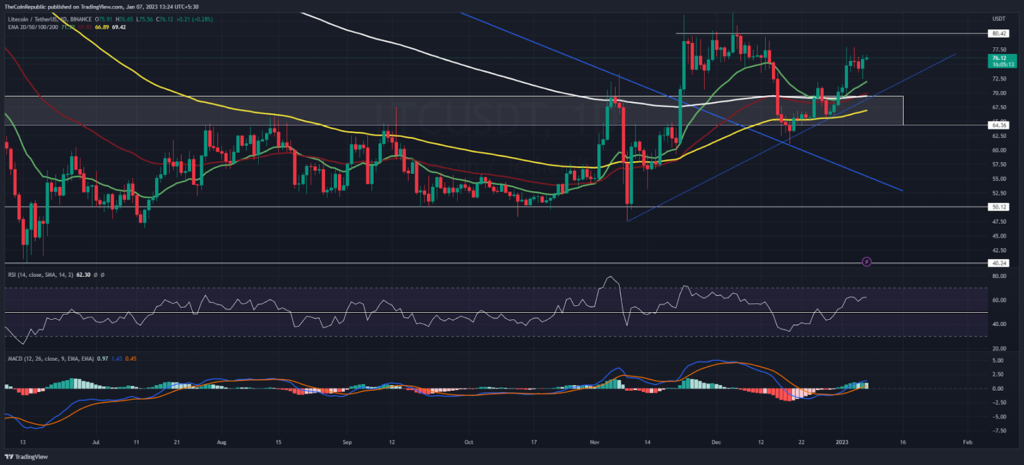
Buyers often get discouraged near the $80 resistance level. Thus again the bulls are pushing the LTC price to the upside to break this area. Specifically, the buyers are keeping the LTC price above the all-important exponential moving averages.
At that point the RSI is standing at 62 and its peak may knock on the doors of overbought next week. Also, the MACD left the oversold zone on the daily chart. Buyers have a chance to break the bullish barrier.
Summary
Litecoin price (LTC) may soon break the bullish barrier of $80 as the crypto completed the December retracement. The price action appears bullish and the technical indicators suggest a strong bullish trend in the charts. Specifically, the buyers have a rescue zone on the ascending trendline to protect themselves.
Support level – $70 and $60
Resistance level – $80 and $100
Disclaimer
The views and opinions stated by the author, or any people named in this article, are for informational ideas only, and they do not establish financial, investment, or other advice. Investing in or trading crypto assets comes with a risk of financial loss.

Nancy J. Allen is a crypto enthusiast, with a major in macroeconomics and minor in business statistics. She believes that cryptocurrencies inspire people to be their own banks, and step aside from traditional monetary exchange systems. She is also intrigued by blockchain technology and its functioning. She frequently researches, and posts content on the top altcoins, their theoretical working principles and technical price predictions.


