
 Home
Home News
News
- Cronos crypto price recovered 15% from the lows and broke out the neckline of double bottom bullish pattern
- CRO bulls defended the yearly lows at $0.0537 and attempting to trade above 50 day EMA
Cronos crypto price had recovered 15% from the recent lows and showing initial signs of trend reversal but the confirmation is still awaited. Currently, CRO/USDT is trading at $0.0623 with the intraday gains of 0.16% and 24 hour volume to market ratio stood at 0.0088
Will the double bottom pattern be sustainable ?
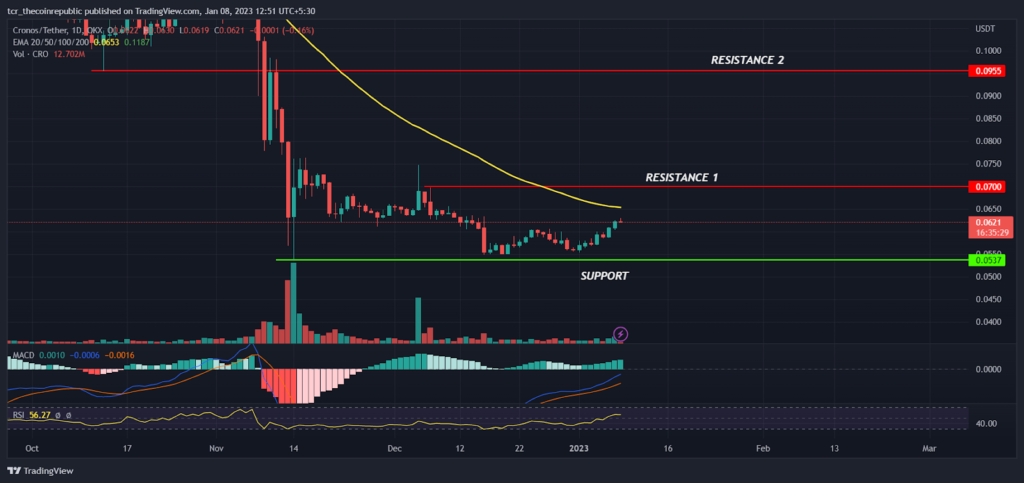
On a daily time frame, Cronos crypto prices are in a downtrend and bear’s are continuously dominating on higher levels. In November CRO slipped below its important support level of $0.0955 with a massive bearish candle which triggered negative sentiment and prices hit a new low at $0.0537. Later, prices consolidated for some time in the range between $0.0537 to $0.0700 while forming a double bottom pattern and bulls had succeeded to break the neckline which showed initial signs of reversal but the confirmation is still awaited. Till the CRO prices are trading below the resistance level of $0.0700, the sustainability of the double bottom pattern is doubtful.

The 50 day EMA (yellow) at $0.0653 sloping sideways will act as an immediate hurdle for bulls followed by next at $0.0700 and $0.0955. On the lower side $0.0537 will act as a savior for bulls. The MACD has generated positive crossover indicating the bullishness may continue in coming days whereas the RSI at 56 sloping sideways denotes neutrality in bullish and bearish sentiment.
Will bulls be able to break the higher range ?
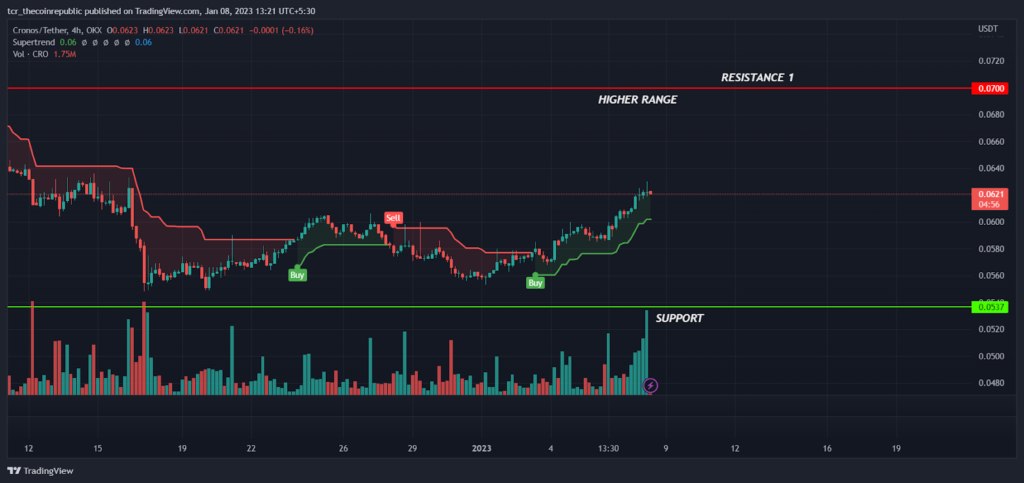
On a lower time frame, CRO prices are reversing upside with a positive momentum while forming higher high candles. The buying volume is also increasing with the increase in price indicating upside momentum may continue for some more time but due to strong resistance on higher zones it will be difficult for bulls to break out of the $0.0700 level. The supertrend indicator had generated a buy signal indicating the short term trend may work in the favor of bulls. However if prices drop below $0.0537 bear may come forward to pull the prices down towards $0.0500 and below levels.
Summary
As per technical analysis, prices had formed a double bottom pattern and bulls had succeeded to break out of the neckline but the sustainability of patterns remains doubtful. As of now, Till prices are trading below $0.0700 traders must avoid creating any buy positions. However if prices sustains above $0.0700 traders might take risk to build long positions for the target of $0.0955 and above by keeping $$0.0537 as SL
Technical levels
Resistance levels : $0.0700 and $0.0955
Support levels : $0.0537 and $0.0400
Disclaimer
The views and opinions stated by the author, or any people named in this article, are for informational ideas only, and they do not establish financial, investment, or other advice. Investing in or trading crypto assets comes with a risk of financial loss.

Andrew is a blockchain developer who developed his interest in cryptocurrencies while pursuing his post-graduation major in blockchain development. He is a keen observer of details and shares his passion for writing, along with coding. His backend knowledge about blockchain helps him give a unique perspective to his writing skills, and a reliable craft at explaining the concepts such as blockchain programming, languages and token minting. He also frequently shares technical details and performance indicators of ICOs and IDOs.


