
 Home
Home News
News

- Token crosses the 50 EMA and holds above it.
- The pair of ETC/USDT is trading at the price level of $20.19 with a decrease of -1.27% in the past 24 hours.
Ethereum Classic (ETC) is showing bullish momentum and has crossed the 50 EMA in an upward direction with high volume. The native coin on the Ethereum Classic network is Ethereum Classic (ETC). Ethereum Classic is a smart contracts-based open-source platform that uses the original Ethereum blockchain.

ETC on the daily chart
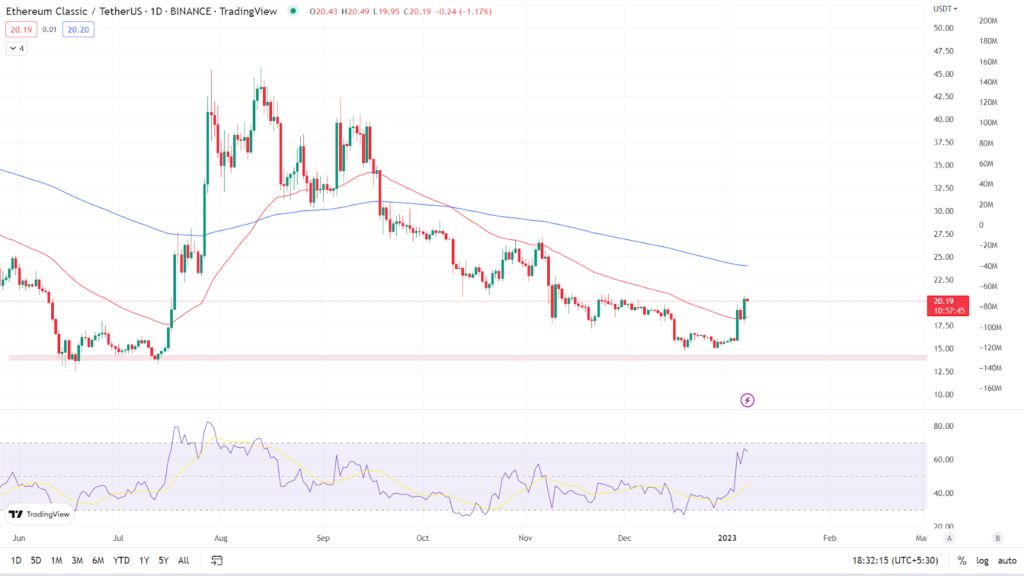
Token is in a strong downtrend with price forming lower highs and lower lows. As we can see on the daily chart, ETC is currently trading at $20.19 with a loss of -1.27% in the past 24 hours. Token is currently trading between 50 EMA and 200 EMA. ( Red line is 50 EMA and the blue line is 200 EMA). Token has crossed 50 EMA with strong volume and has sustained above it.

Relative Strength Index: The asset’s RSI curve is presently trading at 64.53, indicating that it is in the overbought zone. The RSI curve has crossed above the 14 SMA, indicating bullishness. The rise in the price of the token has increased the value of the RSI curve. If bulls continue to drive up the price of the token, the value of the RSI curve will grow even more and may go above 70 which is a strong oversold zone.
Analyst view & Expectations
After bouncing off the support zone, the token has shown bullish momentum. Bulls are trying to seize control. Investors seeking short-term gains can buy now and achieve the aim of the 200 EMA, or they can wait for the token to cross the 200 EMA for more confirmation of the trend. Intraday traders, on the other hand, have a good chance to buy now because bulls are in control and may book profits based on their risk to reward ratio.
According to our current Ethereum Classic price prediction, the price of Ethereum Classic will fall by -2.16% and hit $ 19.75 in the coming days. Our technical indicators indicate that the current sentiment is bearish, with the Fear & Greed Index reading 25. (Extreme Fear). Over the previous 30 days, Ethereum Classic had 13/30 (43%) green days and 8.23% price volatility.
Technical Levels
Major support: $18
Major resistance: $22.20
Conclusion
According to the price action, the token is gaining a bullish pattern and forming a bullish chart pattern. The next resistance level in focus for investors and traders is $22.20. Let’s see if the bulls can maintain their bullish momentum and increase the token’s price.
Disclaimer: The views and opinions stated by the author, or any people named in this article, are for informational ideas only, and they do not establish the financial, investment, or other advice. Investing in or trading crypto assets comes with a risk of financial loss.

Nancy J. Allen is a crypto enthusiast, with a major in macroeconomics and minor in business statistics. She believes that cryptocurrencies inspire people to be their own banks, and step aside from traditional monetary exchange systems. She is also intrigued by blockchain technology and its functioning. She frequently researches, and posts content on the top altcoins, their theoretical working principles and technical price predictions.


