
 Home
Home News
News
- Hedera Price prediction suggests the token’s recovery phase from the lower levels over the daily time frame chart.
- HBAR crypto is trying to recover towards 20-EMA but is still trading below 50, 100 and 200-days Daily Moving Average.
- The pair of HBRA/BTC is at 0.000002374 BTC with an intraday gain of 2.27%.
According to the daily time frame chart’s Hedera price prediction, the HBAR cryptocurrency is currently in a phase of consolidation. Over the chart with a daily time window, HBAR cryptocurrency has been declining since November 2022. But HBAR slept until it reached its lowest point of $0.035 before gaining support and soaring back into the consolidation stage. However, the volume change needs to be improved as it is currently below average.
Hedera Price was trading at $0.040125 and has increased its market capitalization by 1.19% during the last day. The intraday trading session saw a 38.59% spike in trade volume. This implies that buyers are attempting to give the token a jumpstart. The market cap to volume ratio is 0.0169.
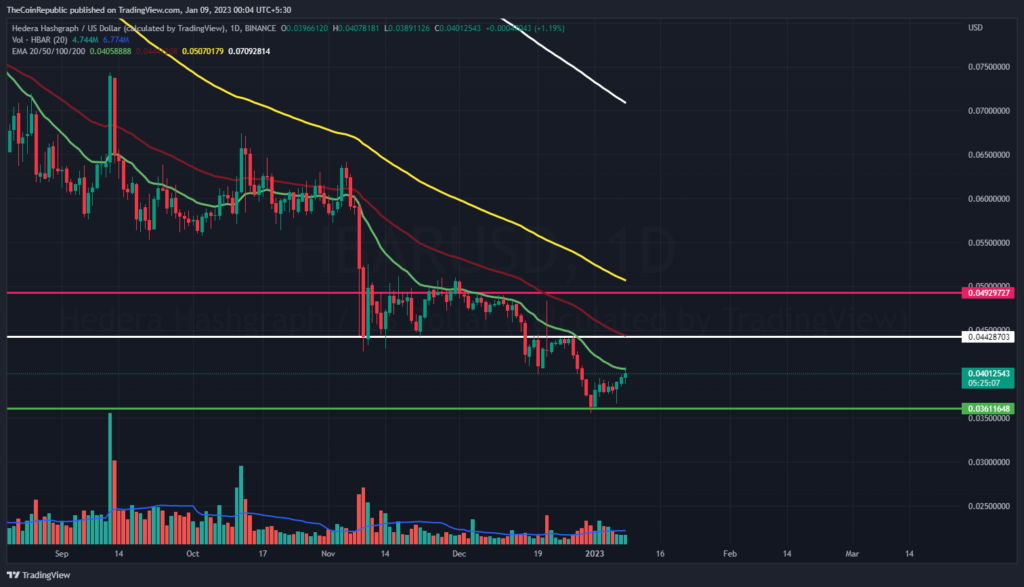
Hedera price prediction showcases the token’s recovery phase over the daily time frame chart. However, volume change is still below average and needs to grow for HBAR crypto to surge towards the primary resistance level at $0.045. Meanwhile, HBAR crypto is trying to recover towards 20-EMA but is still trading below 50, 100 and 200-days Daily Moving Average.
Will Hedera Price Maintain this Recovery Phase?
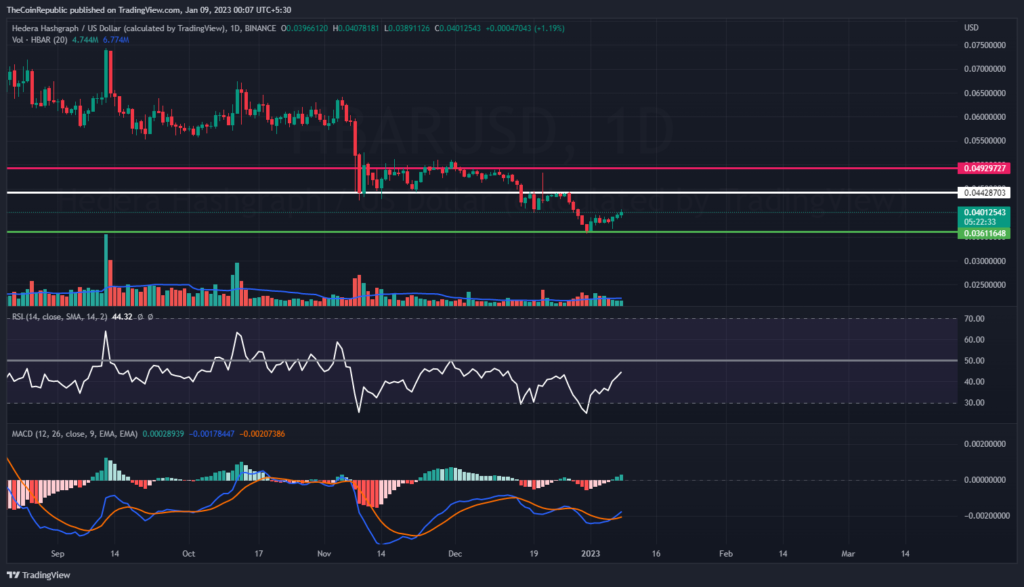
Technical indicators suggest that HBAR cryptocurrency is trying to surge towards the resistance level over the daily time frame chart. Relative strength index showcases the upward trend of HBAR crypto. RSI is at 44 and is surging towards neutrality to register its breakout. MACD exhibits the uptrend momentum of Hedera price over the daily time frame chart. The MACD line is above the signal line after a positive crossover.
Summary
According to the daily time frame chart’s Hedera price prediction, the HBAR cryptocurrency is currently in a phase of consolidation. The intraday trading session saw a 38.59% spike in trade volume. However, volume change is still below average and needs to grow for HBAR crypto to surge towards the primary resistance level at $0.045. Technical indicators suggest that HBAR cryptocurrency is trying to surge towards the resistance level over the daily time frame chart.
Technical Levels
Support Levels: $0.038 and $0.035
Resistance Levels: $0.042 and $0.045
Disclaimer
The views and opinions stated by the author, or any people named in this article, are for informational ideas only, and they do not establish financial, investment, or other advice. Investing in or trading any assets comes with a risk of financial loss.

Andrew is a blockchain developer who developed his interest in cryptocurrencies while pursuing his post-graduation major in blockchain development. He is a keen observer of details and shares his passion for writing, along with coding. His backend knowledge about blockchain helps him give a unique perspective to his writing skills, and a reliable craft at explaining the concepts such as blockchain programming, languages and token minting. He also frequently shares technical details and performance indicators of ICOs and IDOs.


