
 Home
Home News
News
- Shiba Inu price prediction showcases that the SHIB token has been trying to remain inside an interesting pattern over the daily time frame chart.
- SHIB cryptocurrency is trading at 20-EMA and is thriving to surge towards 50, 100 and 200-days Daily Moving Average.
- SHIB army on the move as the SHIB token has finally sustained inside the descending triangle pattern.
Shiba Inu Price Prediction states that SHIB cryptocurrency has been trying to maintain the uptrend momentum of the token after recovering back inside the descending triangle pattern over the daily time frame chart. However, SHIB cryptocurrency is still facing some sustainability issues as sellers may interrupt this bullish momentum for a pullback. Meanwhile, volume change is still faltering as sellers are trying for a pullback during the intraday trading session. The SHIB army needs to wait until the token adapts constant uptrend momentum over the daily time frame chart.
Shiba Inu price was at $0.00000844 and has gained 0.54% of its market capitalization in the past 24-hour period. However, trading volume has decreased by 37% during the intraday trading session. This demonstrates that sellers are getting active and trying to drag Shiba Inu price towards the lower trendline of the descending triangle pattern. Volume to market cap ratio is 0.01876.
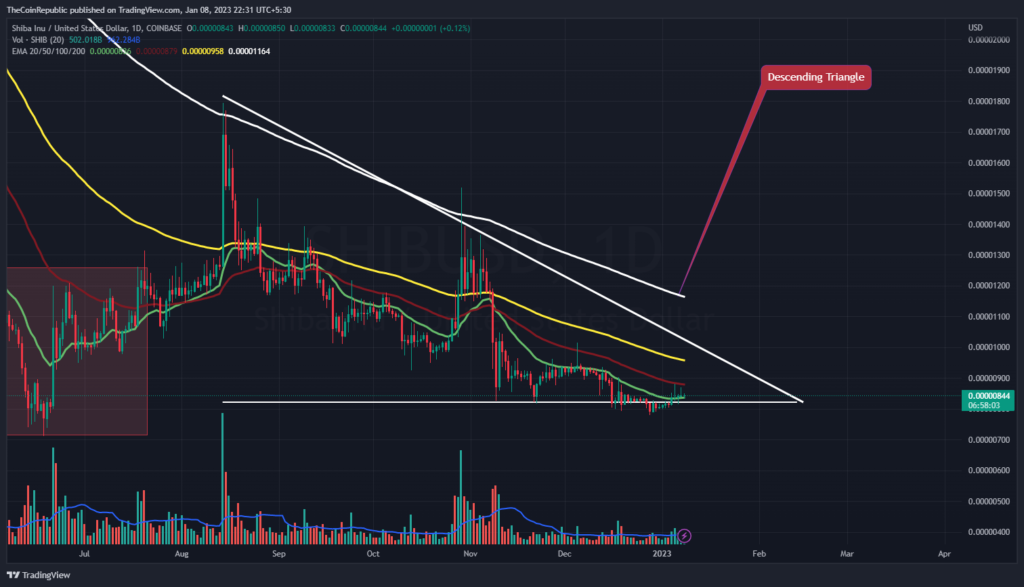
Shiba Inu price prediction suggests the token’s incline momentum inside the falling triangle pattern over the daily time frame chart. However, volume change is still below average and needs to grow for SHIB cryptocurrency to maintain itself inside the pattern. Meanwhile, SHIB cryptocurrency is trading at 20-EMA and is thriving to surge towards 50, 100 and 200-days Daily Moving Average.
Will Shiba Inu Price Maintain its Recovering Streak?
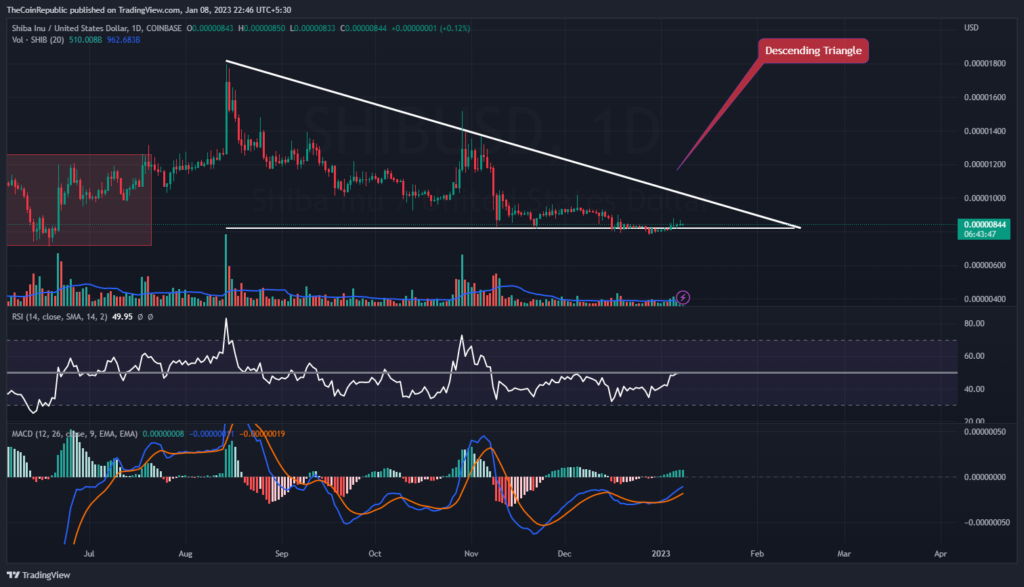
Technical indicators suggest the SHIB token’s recovering rate over the daily time frame chart. Relative Strength Index showcases the uptrend momentum of SHIB crypto. RSI is at 49 and is trying to break out of neutrality. MACD exhibits the upward momentum of the SHIB token. The MACD line is above the signal line after a positive crossover. The SHIB army needs to wait until the token sustains and surges over the daily time frame chart.
Summary
Shiba Inu Price Prediction states that SHIB cryptocurrency has been trying to maintain the uptrend momentum of the token after recovering back inside the descending triangle pattern over the daily time frame chart. RSI is at 49 and is trying to break out of neutrality. MACD exhibits the upward momentum of the SHIB token. The SHIB army needs to wait until the token sustains and surges over the daily time frame chart.
Technical Levels
Support Levels: $0.0000082 and $0.0000080
Resistance Levels: $0.0000087 and $0.0000095
Disclaimer
The views and opinions stated by the author, or any people named in this article, are for informational ideas only, and they do not establish financial, investment, or other advice. Investing in or trading any assets comes with a risk of financial loss.

Andrew is a blockchain developer who developed his interest in cryptocurrencies while pursuing his post-graduation major in blockchain development. He is a keen observer of details and shares his passion for writing, along with coding. His backend knowledge about blockchain helps him give a unique perspective to his writing skills, and a reliable craft at explaining the concepts such as blockchain programming, languages and token minting. He also frequently shares technical details and performance indicators of ICOs and IDOs.


