
 Home
Home News
News

- Vechain price prediction suggests that VET crypto has been consolidating inside the horizontal range bound area over the daily price chart.
- VET crypto has recovered till 20-EMA but is still below 50, 100 and 200-days Daily Moving Average.
- The pair of VET/BTC is at 0.0000009732 BTC with an intraday gain of 1.02%.
Vechain price prediction suggests the token’s consolidation phase of VET cryptocurrency over the daily time frame chart. VET crypto has been slipping since November 2022 over the daily time frame chart. However, VET slept till the lowest level of $0.015 and then gained support to soar back inside the consolidation phase. However, volume change is still below average and needs to be increased.

Vechain price was at $0.01659037 and has gained 0.93% of its market capitalization in the past 24-hour period. However, trading volume has decreased by 4.96% during the intraday trading session. This demonstrates that sellers are trying for a pullback. Volume to market cap ratio is 0.01989.

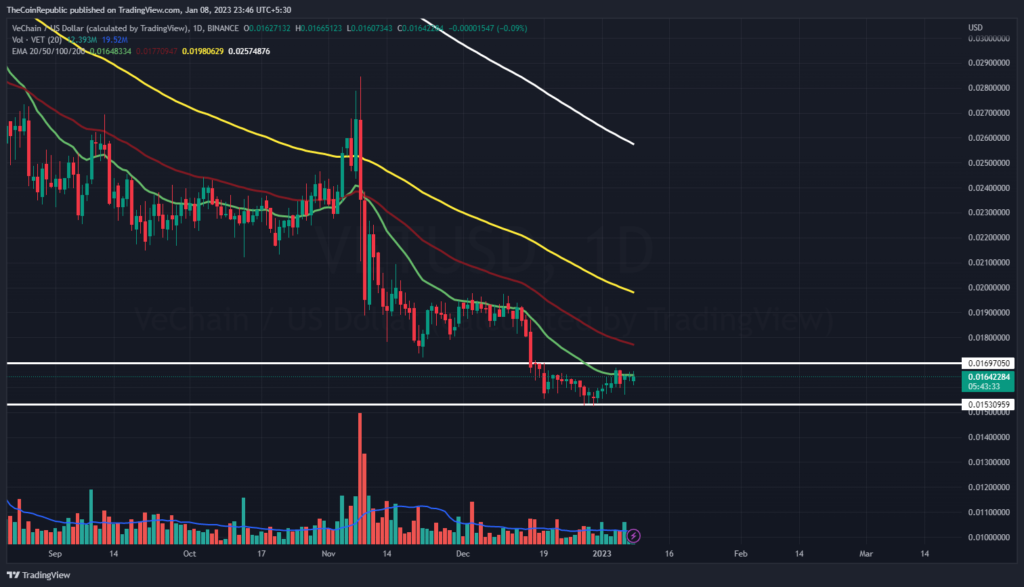
Vechain price prediction suggests that VET crypto has been trying to sustain at the current level to surge towards the upper price range of the consolidation phase. However, volume change can be seen below average and needs to grow for VET crypto to surge towards the upper price range of the horizontal range bound area. Meanwhile, VET crypto has recovered till 20-EMA but is still below 50, 100 and 200-days Daily Moving Average.
What do Technical Indicators suggest about Vechain Price?
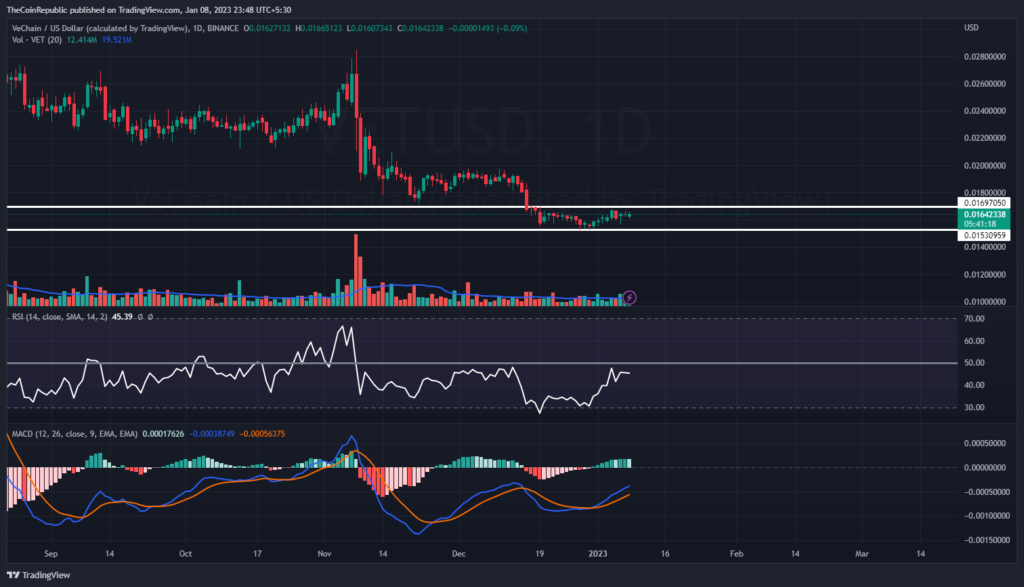
Technical indicators suggest the consolidation phase of Vechain price over the daily time frame chart. Relative strength index showcases the sideways momentum of VET crypto. RSI is at 45 and is flat below neutrality. MACD exhibits the uptrend momentum of VET cryptocurrency. The MACD line is above the signal line after a positive crossover.
Summary
Vechain price prediction suggests the token’s consolidation phase of VET cryptocurrency over the daily time frame chart. However, volume change can be seen below average and needs to grow for VET crypto to surge towards the upper price range of the horizontal range bound area. Technical indicators suggest the consolidation phase of Vechain price over the daily time frame chart. RSI is at 45 and is flat below neutrality. MACD exhibits the uptrend momentum of VET cryptocurrency.
Technical Levels
Support Levels: $0.0159981 and $0.1550
Resistance Levels: $0.01681 and $0.020
Disclaimer
The views and opinions stated by the author, or any people named in this article, are for informational ideas only, and they do not establish financial, investment, or other advice. Investing in or trading any assets comes with a risk of financial loss.

Andrew is a blockchain developer who developed his interest in cryptocurrencies while pursuing his post-graduation major in blockchain development. He is a keen observer of details and shares his passion for writing, along with coding. His backend knowledge about blockchain helps him give a unique perspective to his writing skills, and a reliable craft at explaining the concepts such as blockchain programming, languages and token minting. He also frequently shares technical details and performance indicators of ICOs and IDOs.


