
 Home
Home News
News

- Veru Inc. shares may surge by this time of 2023 and will recover itself with a strong spike as speculated by some analysts from established financial firms.
- VERU stock price has been consolidating since the November 2022 fall.
- VERU share price may surge above $10 with maximum percentage of growth in the mid 2023.
Veru stock price has been consolidating at April 2022 lows and is trying to gain support at the lower level over the daily price chart. However, VERU share price needs to surge towards its recovery and must accumulate buyers. VERU investors need to wait until share price starts accumulating buyers in order to surge over the daily price chart. Some analysts confirmed that Veru share price can surge with a strong uptrend momentum in the mid of 2023.

Veru stock price (NASDAQ:VERU) was at $5.41 and has dropped by 0.09% of its market capitalization in the day’s trading session. This demonstrates that buyers are resisting the fall momentum of Veru share price over the daily price chart.

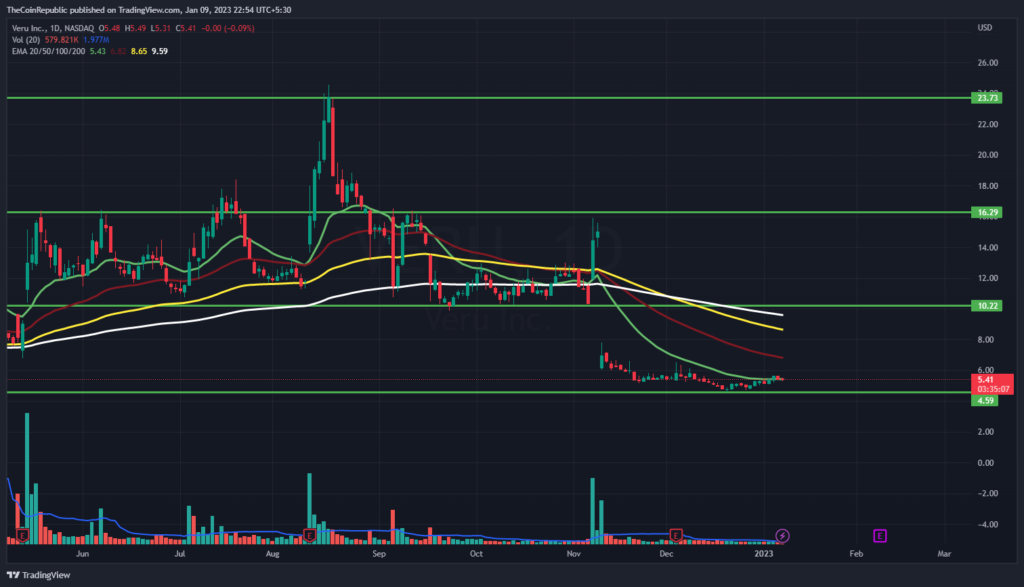
Veru stock price has been consolidating over the daily time frame chart. VERU must accumulate buyers during the day’s trading session in order to surge over the daily price chart. However, volume change can be below average and needs to grow for VERU stock to register its breakout. Meanwhile, VERU share price is trading at 20-EMA and may recover towards 50, 100 and 200-days Daily Moving Average. Some interesting levels to be attained by VERU stock price are $10, $16 and $23.
Will VERU Stock Price (NASDAQ:VERU) Revert Current Trend?
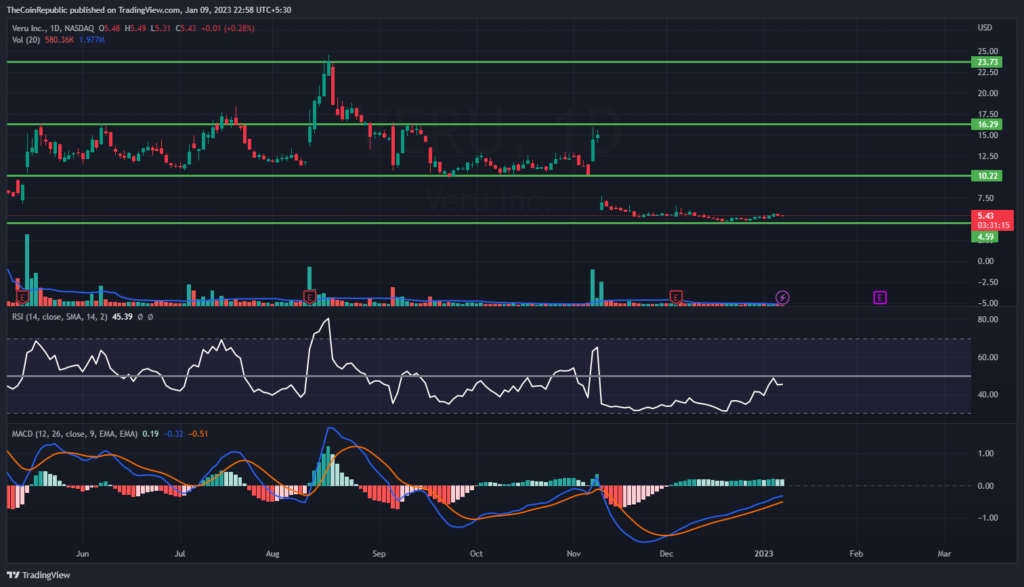
VERU stock price must soar towards the recovery phase by registering maximum growth in 2023. Technical indicators suggest the consolidation phase over the daily price chart.
Relative Strength Index showcases the sideways momentum of VERU share price. RSI is at 45 and is flat below neutrality. MACD exhibits the consolidation phase of VERU share price. The MACD line is parallel to the signal line showcasing no change in the momentum of VERU stock price.
Summary
Veru share price has been consolidating at April 2022 lows and is trying to gain support at the lower level over the daily price chart. However, VERU share price needs to surge towards its recovery and must accumulate buyers. However, volume change can be below average and needs to grow for VERU stock to register its breakout. Technical indicators suggest the consolidation phase over the daily price chart. The MACD line is parallel to the signal line showcasing no change in the momentum of VERU share price.
Technical Levels
Support Levels: $5.00 and $4.30
Resistance Levels: $7.00 and $10.00
Disclaimer
The views and opinions stated by the author, or any people named in this article, are for informational ideas only, and they do not establish financial, investment, or other advice. Investing in or trading any assets comes with a risk of financial loss.

Andrew is a blockchain developer who developed his interest in cryptocurrencies while pursuing his post-graduation major in blockchain development. He is a keen observer of details and shares his passion for writing, along with coding. His backend knowledge about blockchain helps him give a unique perspective to his writing skills, and a reliable craft at explaining the concepts such as blockchain programming, languages and token minting. He also frequently shares technical details and performance indicators of ICOs and IDOs.


