
 Home
Home News
News

- The AAVE token price is trading above the demand zone on a daily time frame.
- The pair of AAVE/USD is trading at the price level of $55.38 with a decrease of -2.41% in the past 24 hours.
Aave, along with Uniswap (UNI), Compound (COMP), and Curve, is recognized as one of Ethereum’s top DeFi protocols. Aave is also used on the layer-1 network Avalanche (AVAX) and the layer-2 protocol Polygon on Ethereum (MATIC).

AAVE gaining bullish momentum on the daily chart
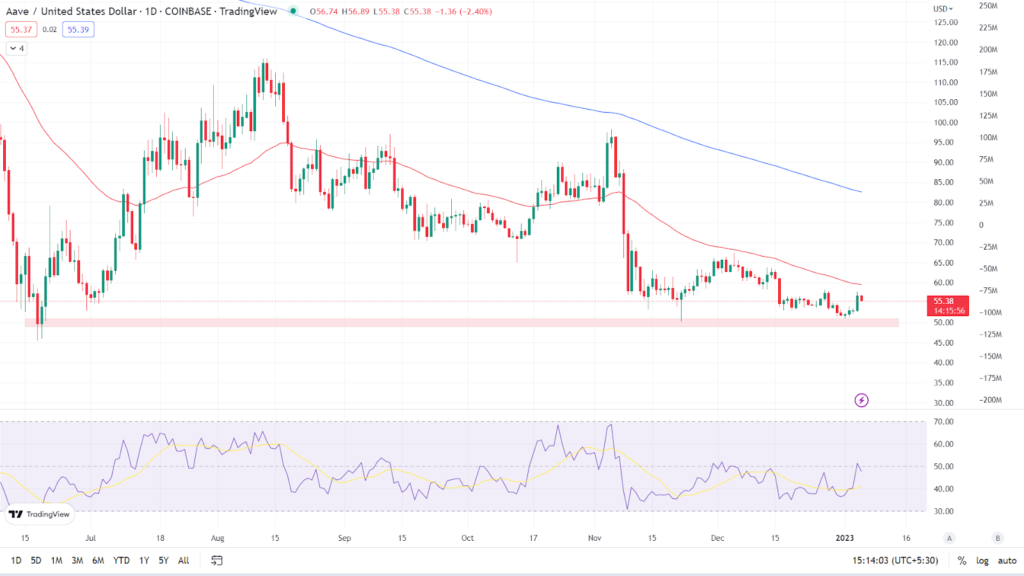
The AAVE token has rebounded from the long-term demand zone. The AAVE token is presently trading at $55.38 on the daily chart. It is now trading below its key Moving Averages (50 and 200 EMA). (Red line is 50 EMA and the blue line is 200 EMA). Token is facing resistance at the 50 EMA, and in order to break the downtrend and continue the uptrend, the token must cross the 50 EMA in an upward direction and sustain above it.

Relative Strength Index: The asset’s RSI curve is currently trading at 47.54. As the token gained bullish momentum after hitting the demand zone, the RSI curve crossed above the 14 SMA. As the price encounters resistance and a red candle forms on the chart, the value of the RSI curve falls. If the token is able to break through the resistance level, the RSI curve may cross over the 50-point mark indicating bullish momentum.
Analyst view & Expectations
Even though the token has shown bullish momentum after hitting the demand zone, there are still many obstacles ahead. The 50 EMA and $57.80 are the key resistance levels to watch in the upcoming days. Investors are advised not to buy right now and to wait for trend confirmation. Intraday traders can go long if the token crosses above the 50 EMA and short if it falls below the demand zone.
According to our current AAVE price forecast, the value of AAVE is expected to fall by -3.37% and hit $ 53.50 in the coming days. Our technical indicators indicate that the current sentiment is bearish, with the Fear & Greed Index reading 29. (Fear). Over the previous 30 days, AAVE has 15/30 (50%) green days and 6.35% price volatility. According to our Aave forecast, now is not a good time to buy Aave.
Technical Levels
Major support: $49.65
Major resistance: $57.80
Conclusion
Token has once again taken off from the demand zone but bears are denying bulls dominance. Investors should wait for clear indication and then act accordingly. Intraday traders have good opportunities on both buy and sell side.
Disclaimer
The views and opinions stated by the author, or any people named in this article, are for informational ideas only, and they do not establish the financial, investment, or other advice. Investing in or trading crypto assets comes with a risk of financial loss.

Nancy J. Allen is a crypto enthusiast, with a major in macroeconomics and minor in business statistics. She believes that cryptocurrencies inspire people to be their own banks, and step aside from traditional monetary exchange systems. She is also intrigued by blockchain technology and its functioning. She frequently researches, and posts content on the top altcoins, their theoretical working principles and technical price predictions.


