
 Home
Home News
News

- Token shows bullish actions in previous sessions.
- On the daily chart, a bullish divergence has formed.
- The pair of CAKE/USDT is trading at the price level of $3.28 with a decrease of -0.40% in the past 24 hours.
PancakeSwap (CAKE) is now in a downtrend, with lower highs and lower lows. Token was rejected at the supply zone and formed a double top pattern. Bears are gaining control after the formation of a double top, causing the price of the token to fall.

Bears taking command on the daily chart
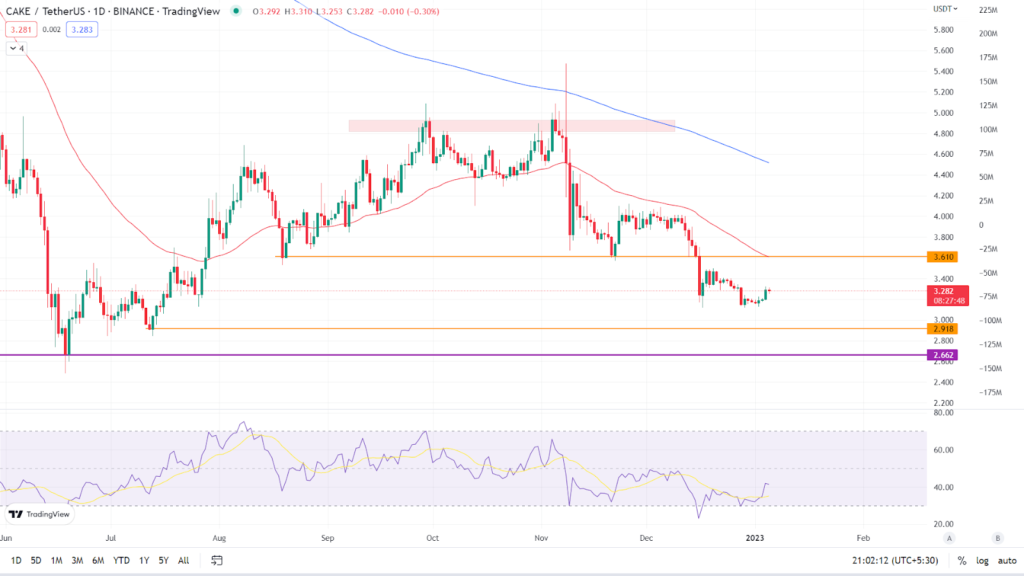
The token’s overall outlook is bearish. The daily chart shows that PancakeSwap (CAKE) is presently trading at $3.28. Token is now trading below its 50 and 200 EMA moving averages. (Red line is 50 EMA and the blue line is 200 EMA). Token is continually encountering resistance at the 50 EMA and is unable to keep its position above it.
Relative Strength Index: The asset’s RSI curve is presently trading at 41.16, indicating that it is in the oversold zone. A bullish divergence may be seen. When prices fall to a new low but an indicator fails to fall to a new low, this is referred to as bullish divergence. The price is falling, but the RSI is showing bullish strength, as the RSI curve passes the 14 SMA in an upward direction. In the following days, we may see the token retrace to the 50 EMA.
Analyst view & Expectations
The token is now in a downtrend, but due to bullish divergence, we may witness a retracement in the following days. Investors are advised not to buy right now and to wait for trend confirmation. They can buy if the price stays above the 50-day moving average. Intraday traders have a good chance to go short if the token falls below $2.918 and book gains based on their risk to reward ratio.
According to our current PancakeSwap price prediction, the value of PancakeSwap is expected to rise by 1.14% in the next few days, reaching $ 3.32. Our technical indicators indicate that the current sentiment is bearish, with the Fear & Greed Index reading 29. (Fear). Over the previous 30 days, PancakeSwap has 12/30 (40%) green days and 8.39% price volatility. According to our PancakeSwap forecast, now is not a good time to buy PancakeSwap.
Technical Levels
Major support: $3.10
Major resistance: $3.490
Conclusion
Token is hitting lower highs and lower lows and is in downtrend after forming double top at the supply zone. Investors should wait for clear indication before investing.
Disclaimer: The views and opinions stated by the author, or any people named in this article, are for informational ideas only, and they do not establish the financial, investment, or other advice. Investing in or trading crypto assets comes with a risk of financial loss.

Nancy J. Allen is a crypto enthusiast, with a major in macroeconomics and minor in business statistics. She believes that cryptocurrencies inspire people to be their own banks, and step aside from traditional monetary exchange systems. She is also intrigued by blockchain technology and its functioning. She frequently researches, and posts content on the top altcoins, their theoretical working principles and technical price predictions.


