
 Home
Home News
News
- In recent days, the token has shown bullish actions.
- On the daily chart, token is on verge of breakout of descending triangle pattern
- The pair of SNX/USD is trading at the price level of $1.600 with a gain of 4.25% in the past 24 hours.
For the past few days, the token has been consolidating in the demand zone and has given an upward breakout, flipping the trend. The next few days will be important for the token since it is on the verge of breaking out of the Descending triangle pattern.

SNX on the daily chart
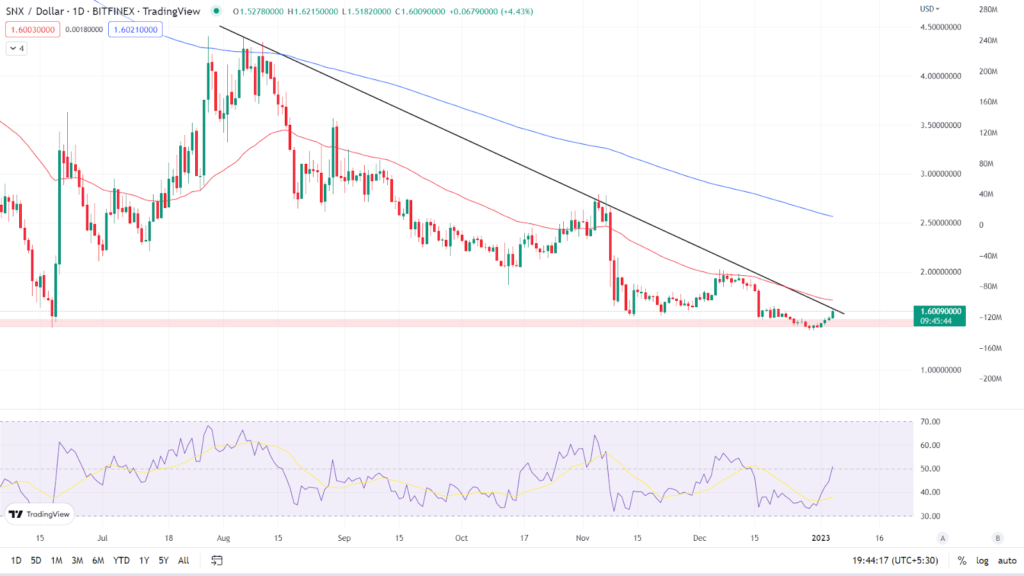
After gaining support from the demand zone, the token is gaining bullish momentum. As can be seen, the token is presently trading at $1.600, up 4.25% in the last 24 hours. The price is now trading below its key Moving Averages (50 and 200 EMA). The 50 EMA is providing resistance to the price (red line is 50 EMA, blue line is 200 EMA). The Descending Triangle pattern is expected to break out in the next few days.

Relative Strength Index: The asset’s RSI curve is presently trading at 51.60, indicating that it is in the overbought zone. The rise in the price of tokens has caused the value of the RSI curve to rise even further. The RSI curve has crossed over the 14 SMA, indicating that the trend is bullish. If the token successfully breaks out of the Descending Triangle pattern, the RSI curve’s value may rise even further.
Analyst view and Expectations
Bulls are gaining strength, and a bullish breakthrough of the Descending triangle pattern is possible in the next few days. In addition to the breakthrough, the token will cross the 50 EMA upward, indicating a short-term bullish trend. Investors can buy after the price breaks out and closes above the 50-day moving average. Once the breakthrough happens, intraday traders will have a good opportunity to go long. The RSI indicator also supports the rise in token price, giving us more confirmation.
According to our current Synthetix(SNX) price prediction, the value of Synthetix is expected to rise by 3.85% in the next few days, reaching $ 1.657980. Our technical indicators indicate that the current sentiment is Neutral, with the Fear & Greed Index reading 29. (Fear). Over the previous 30 days, Synthetix had 15/30 (50%) green days and 11.26% price volatility. According to our Synthetix forecast, now is a good time to buy Synthetix
Technical Levels
Major support: $1.436
Major resistance: $1.650
Conclusion
With bulls gaining momentum, the bearish trend may be coming to an end. Token is on the edge of a breakthrough, with the indicator in favor providing more confirmation.
Disclaimer: The views and opinions stated by the author, or any people named in this article, are for informational ideas only, and they do not establish the financial, investment, or other advice. Investing in or trading crypto assets comes with a risk of financial loss.

Nancy J. Allen is a crypto enthusiast, with a major in macroeconomics and minor in business statistics. She believes that cryptocurrencies inspire people to be their own banks, and step aside from traditional monetary exchange systems. She is also intrigued by blockchain technology and its functioning. She frequently researches, and posts content on the top altcoins, their theoretical working principles and technical price predictions.


