
 Home
Home News
News
- Lucid group stock has taken U -Turn from the 52 week low at $6.09 and rising upwards while forming higher high candles.
- EV maker Lucid group stock had formed a bullish engulfing candle on a weekly basis and showing signs of short term reversal.
The Lucid stock is trading with bullish cues and buyers are trying to reverse the short term trend in the favor of bulls. However, it will not be easy for bulls to break out of the 50 day EMA hurdle in coming days. The previous session of NASDAQ : LCID is closed at $7.93 with the intraday gains of 10.29% and the market cap stands at $14.498B
Is the LUCID stock worth buying in 2023 ?
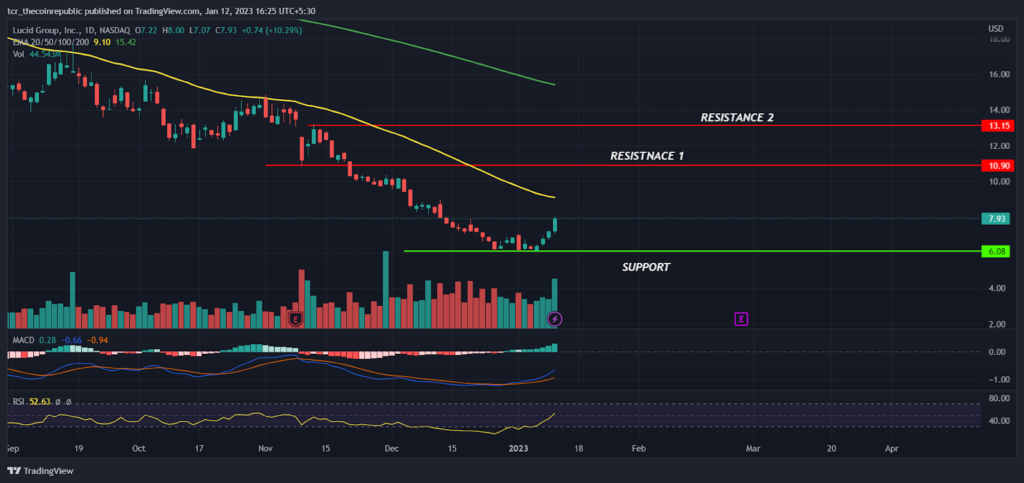
On a daily time frame, Lucid stock had been in downtrend and slipping down while forming lower lows swings. A few weeks ago, Lucid group raised 1.5 billion from the Saudi public wealth fund and other investors due to which positive price movements are expected but unfortunately prices reacted negatively and hit a 52 week low at $6.09
After a little bit of consolidation, price took support at $6.09 and recovered 30% approx from the recent low and reversing upwards while forming higher high candles indicates some genuine institutional buyers might be betting on EV maker Lucid stock and expecting out performance in the year 2023 but it should be treated as risky bet because far more better investing options are available in the EV market. However, from the trading perspective Lucid prices seem to oversold and short term relief rally may easily drive the price upwards.
The 200 day EMA (green) which is far away from the current price indicates the positional trend to remain in the bear grip and the 50 day EMA (yellow) at $9.10 will act as an immediate hurdle for bulls followed by the next hurdle at $11.00 and $13.00. After a long time, The MACD had generated a positive crossover and histogram bars are on rise indicating bullishness may continue for some more time and the RSI at 52 sloping upside denotes balance between bullish and bearish positions.
Summary
Lucid stock price had lost 32% of its value on a previous month basis which indicates the bears dominance on higher levels but recently prices seems to be oversold and short term relief rally is getting triggered from the lower levels. Technical analysis suggests prices may trade with the bullish bias in coming days but it will be difficult for buyers to break out of the 200 day EMA hurdle and reverse the trend in the favor of bulls. Therefore, Short term traders may look for buying opportunities by keeping $6.00 as SL but Investors should buy only when the price breakout of the above 200 day EMA resistance.
Technical levels
Resistance levels : $10.00 and $13.00
Support levels : $6.00 and $4.00
Disclaimer
The views and opinions stated by the author, or any people named in this article, are for informational purposes only, and they do not establish financial, investment, or other advice. Investing in or trading crypto assets comes with a risk of financial loss.

Nancy J. Allen is a crypto enthusiast, with a major in macroeconomics and minor in business statistics. She believes that cryptocurrencies inspire people to be their own banks, and step aside from traditional monetary exchange systems. She is also intrigued by blockchain technology and its functioning. She frequently researches, and posts content on the top altcoins, their theoretical working principles and technical price predictions.


