
 Home
Home News
News
- FSR stock price is facing certain sustainability issues at the resistance level of $8.00 and getting distributed from the resistance level.
- FSR Share price is getting detained from the upper level of the horizontal range-bound area over the daily time frame chart.
- FSR share price has recovered above 20, 50 and 100-days Daily Moving Average, and is trying to sustain at 100-days DMA.
Fisker Inc. (FSR) stock price has been trading inside the horizontal range-bound area over the daily time frame chart. FSR stock price has surged towards the upper price range of the consolidation phase and is currently trying to sustain at $8.00. FSR share price needs to maintain the uptrend momentum to avoid returning from the resistance level. However, sellers are approaching to short the market for FSR share price. Fisker Inc. (FSR) stock price needs to maintain the buyers accumulation rate as soon as Friday’s trading session starts.
FSR stock price was at $8.05 and has gained 0.37% of its market capitalization by the closing of Thursday’s trading session. However, trading volume showcases that sellers are approaching to short the market for FSR share price.
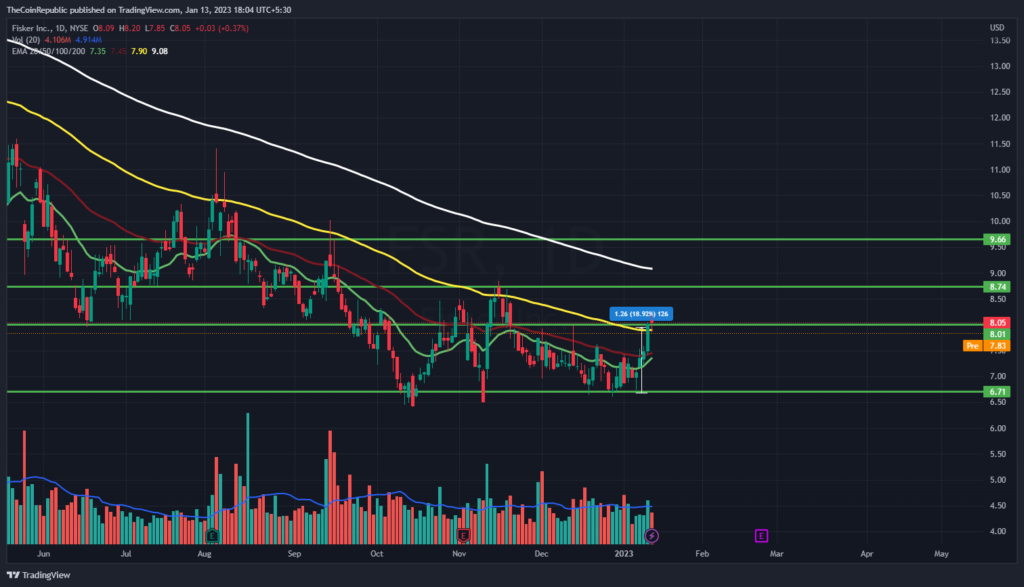
FSR stock price has been trading with strong uptrend momentum inside the horizontal range-bound area and was able to register its breakout from the consolidation phase. However, it looks like FSR share price may get distributed from the resistance level of the consolidation phase at $8.00 and FSR share price may return back inside the consolidation phase. Meanwhile, volume change can be seen below average and under influence of sellers. FSR share price has recovered above 20, 50 and 100-days Daily Moving Average, and is trying to sustain at 100-days DMA.
Change in Momentum of FSR Stock Price
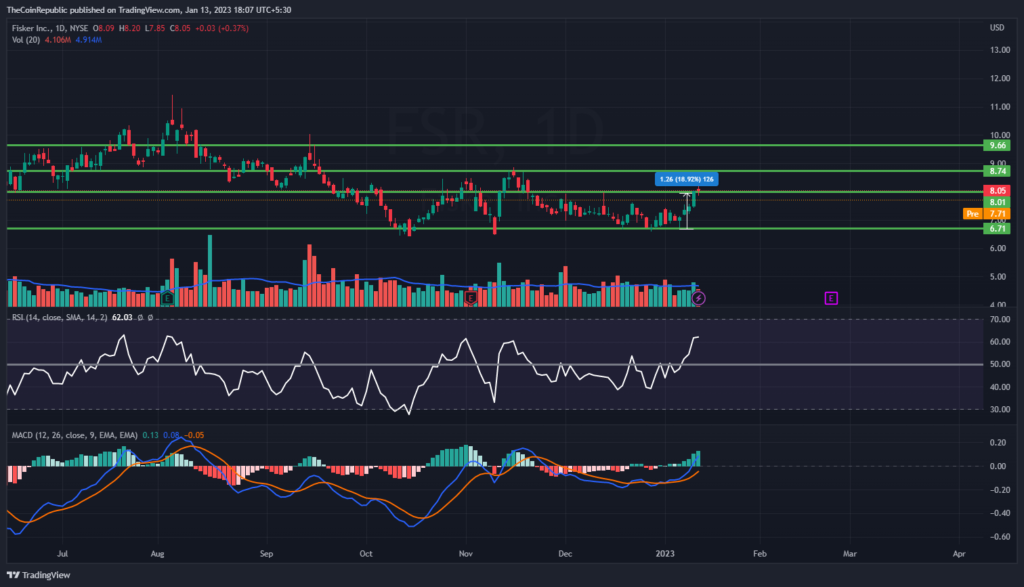
FSR share price has been trying to sustain at the current level and must maintain itself above the consolidation phase on Friday’s trading session. Technical indicators suggest the faltering steps of FSR share price at the upper price range of the consolidation phase.
Relative Strength Index showcases the change in momentum of FSR share price. RSI is at 62 and is flat below overbought territory. MACD exhibits the uptrend momentum of FSR share price. The MACD line is above the signal line after a positive crossover. Investors in FSR stock need to wait until the stock price sustains above $8.00.
Summary
Fisker Inc. (FSR) stock price has been trading inside the horizontal range-bound area over the daily time frame chart. FSR share price has surged towards the upper price range of the consolidation phase and is currently trying to sustain at $8.00. However, it looks like FSR share price may get distributed from the resistance level of the consolidation phase at $8.00 and FSR share price may return back inside the consolidation phase. Technical indicators suggest the faltering steps of FSR share price at the upper price range of the consolidation phase.
Technical Levels
Support Levels: $7.35 and $7.20
Resistance Levels: $8.07 and $10.00
Disclaimer
The views and opinions stated by the author, or any people named in this article, are for informational ideas only, and they do not establish financial, investment, or other advice. Investing in or trading crypto assets comes with a risk of financial loss.

Andrew is a blockchain developer who developed his interest in cryptocurrencies while pursuing his post-graduation major in blockchain development. He is a keen observer of details and shares his passion for writing, along with coding. His backend knowledge about blockchain helps him give a unique perspective to his writing skills, and a reliable craft at explaining the concepts such as blockchain programming, languages and token minting. He also frequently shares technical details and performance indicators of ICOs and IDOs.


