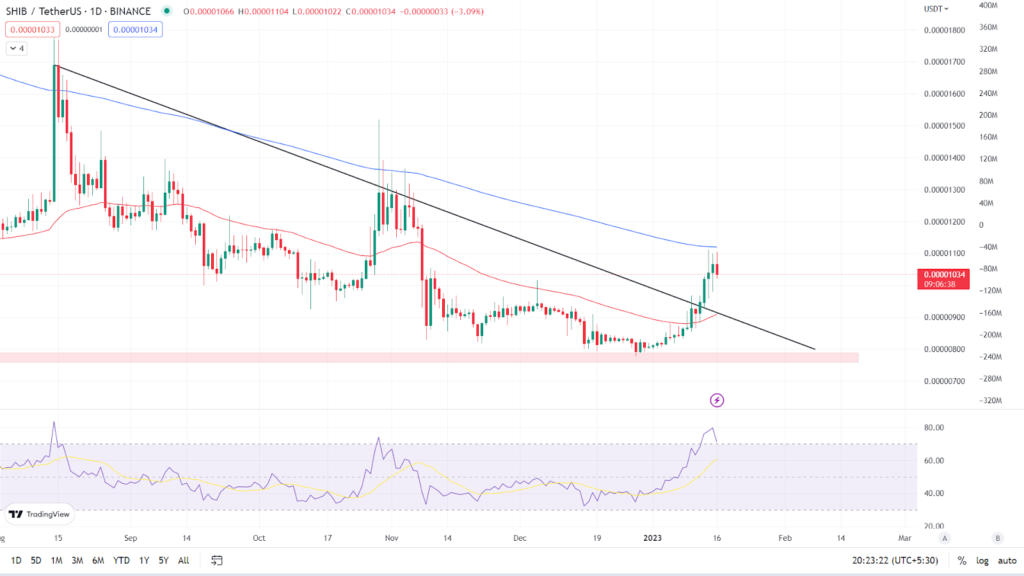
- Token forms a strong red candle near 200 EMA.
- The pair of SHIB/USDT is trading at the price level of $0.00001034 with a decrease of -3.35% in the past 24 hours.
SHIBA Inu token has broken above the long term trend line and is currently facing resistance at the 200 EMA on the daily time frame. Shiba Inu is one of the market’s most popular meme currencies. The self-described “Dogecoin killer” has proven to be more than a joke coin. Many are attempting to interpret the coin’s potential for the months and years ahead as it draws more investors.
SHIBA Inu on the daily chart

SHIBA Inu has shown bullish momentum in recent days, breaking above the trend line and 50 EMA. According to the daily chart, SHIBA Inu token is currently trading at $0.00001034 with a -3.35% loss in the last 24 hours. It is trading between its 50 and 200 EMA moving averages. (Red line is 50 EMA and the blue line is 200 EMA). On the daily time frame, it is facing resistance at the 200 EMA.
Relative Strength Index: The asset’s RSI curve is currently trading at 70.69, indicating that it is in the overbought zone. The rise in the price of the token has increased the value of the RSI curve, but as of now, we can see a strong bearish candle forming at the 200 EMA and the value of the RSI curve is also dropping. If this trend continues, the RSI curve’s value may fall even further.
Analyst view & Expectations
On daily time frame, the token has bounced from the demand zone, forming strong bullish candles. Investors should wait for the token to cross the 200 EMA and stay above it on a daily time frame to confirm an uptrend. Intraday traders, on the other hand, have a good opportunity to go long once the token breaks over the 200 EMA and book profits based on their risk to reward ratio.
According to our current SHIBA INU price prediction, the value of SHIBA INU is expected to climb by 2.99% over the next few days, reaching $ 0.00001055 in value. Our technical indicators indicate that the current sentiment is bearish, with the Fear & Greed Index reading 45. (Fear). Over the previous 30 days, SHIBA INU had 18/30 (60%) green days and 5.97% price volatility. According to our SHIBA INU forecast, now is not a good time to buy SHIBA INU.
Technical Levels
Major support: $0.00000945
Major resistance: $0.00001162 & 200 EMA on daily time frame.
Conclusion
Token has breached the long term trend line in an upward direction, but is now facing resistance at the 200 EMA and forming a strong red candle. Investors are advised to wait for clear indication before acting.
Disclaimer: The views and opinions stated by the author, or any people named in this article, are for informational ideas only, and they do not establish the financial, investment, or other advice. Investing in or trading crypto assets comes with a risk of financial loss.

With a background in journalism, Ritika Sharma has worked with many reputed media firms focusing on general news such as politics and crime. She joined The Coin Republic as a reporter for crypto, and found a great passion for cryptocurrency, Web3, NFTs and other digital assets. She spends a lot of time researching and delving deeper into these concepts around the clock, and is a strong advocate for women in STEM.


 Home
Home News
News


