
 Home
Home News
News

- Casper price shot up 40% on a monthly basis and formed a bullish reversal pattern
- CSPR crypto price recovered 50% approx from the recent low and breakout of the 50 and 200 day EMA
- CSPR network price races towards the supply zone at $0.0500 and RSI curve had entered the overbought zone
The Casper crypto is trading with bullish cues and buyers are trying to reverse the positional trend in the favor of bulls.The previous few sessions were dominated by buyers and prices shot up almost 40% on the monthly basis. Currently, The pair of CSPR/USDT is trading at $0.0389 with an intraday gains of 5.14% and the 24-hour volume to market cap ratio at 0.0514

Will the Casper price be able to hold the 200 Day EMA ?
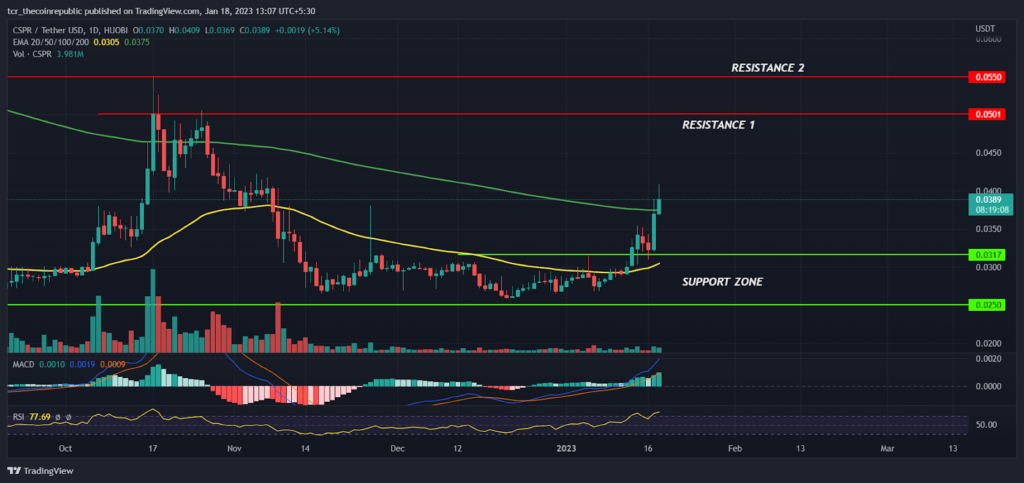
On the daily time frame, The Casper network price had shown surprising recovery from the long term demand zone and reversing upwards while forming higher high candles. From the past couple months, CSPR prices are stuck in the narrow range between $0.0250 to $0.0317 with a bearish bias but recently some aggressive buyers came forward and succeeded to break out of the higher range which had triggered the positive sentiment and CSPR came into the spotlight of traders.

The Casper crypto prices formed a short term base at $0.0250 and succeeded to reclaim 50 and 200 day EMA indicates the positional trend is reversing in the favor bulls and dips would provide an opportunity to accumulate at lower levels. However, prices need to hold the EMA’s for the further upward movement. On the higher side $0.0500 and $0.0550 will act as supply zones and it will be difficult for bulls to dominate on the higher levels.
The Casper prices shot up 40% on the monthly basis and formed a giant bullish candle showing the confidence of bulls at lower levels. However prices are near to overbought zone and if any minor correction triggers from the supply zone then $0.0300 and $0.0250 will act as a support zone for bulls. The MACD had generated a positive crossover indicates the strength of buyers whereas the RSI curve at 77 denotes prices are inside the overbought territories.
Summary
The Casper network has broken out from the narrow range consolidation and reclaim 50 and 200 day EMA which shows the confidence of bulls and if buyers are able to hold the EMA’s we may see further upwards movement in a short span of time. The Technical analysis suggests that the recent breakout looks sustainable and minor corrections will provide an opportunity to build long positions. Therefore, traders may look for buying opportunities for the target of $0.0500 and above by keeping $0.0250 as SL. However, if prices drop below $0.0250 bears may try to drag the prices towards further lows.
Technical levels
Resistance levels : $0.0500 and $0.0550
Support levels : $0.0300 and $0.0250
Disclaimer
The views and opinions stated by the author, or any people named in this article, are for informational purposes only, and they do not establish financial, investment, or other advice. Investing in or trading crypto assets comes with a risk of financial loss.

Andrew is a blockchain developer who developed his interest in cryptocurrencies while pursuing his post-graduation major in blockchain development. He is a keen observer of details and shares his passion for writing, along with coding. His backend knowledge about blockchain helps him give a unique perspective to his writing skills, and a reliable craft at explaining the concepts such as blockchain programming, languages and token minting. He also frequently shares technical details and performance indicators of ICOs and IDOs.


