
 Home
Home News
News

- Token has shown bullish actions in the previous sessions.
- EOS is trading above the 50 EMA on a daily time frame.
- The pair of EOS/USDT is trading at the price level of $1.039 with a gain of 0.30% in the past 24 hours.
With strong bullish momentum, EOS token has bounced from the long term demand zone and crossed the 50 EMA on the daily time frame. Token has begun a short-term uptrend, and it will be interesting to watch if bulls can sustain this uptrend and deny bears dominance.

EOS on daily time frame
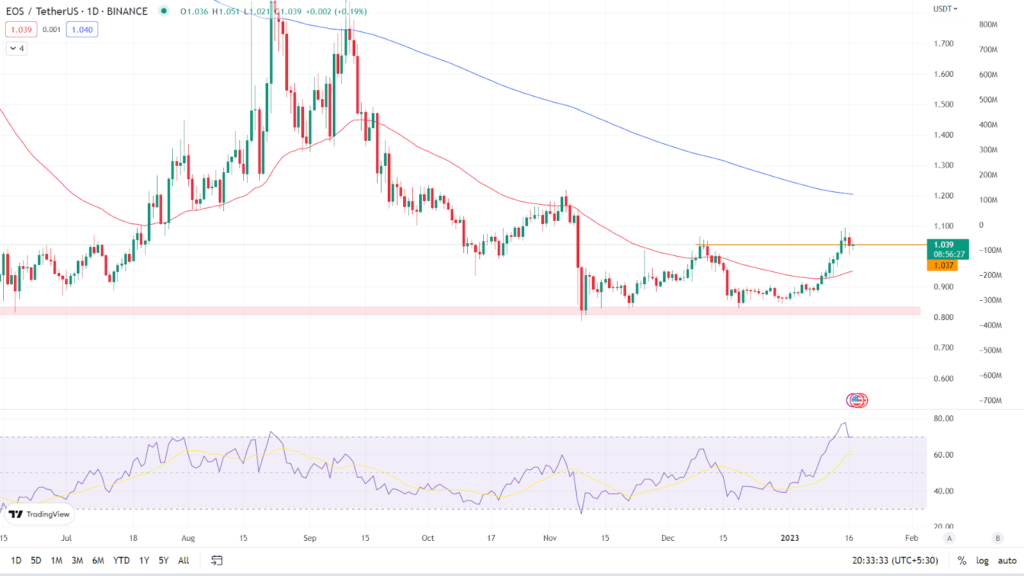
Token has shown signs of strong bullish momentum. According to the daily chart, EOS token is currently trading at $1.039, up 0.30% in the last 24 hours. It is trading between its two key Moving Averages, the 50 EMA and the 200 EMA. (Red line is 50 EMA and the blue line is 200 EMA). Token has broken the resistance level of $1.037. Let’s see if it can sustain above this level or not.

Relative Strength Index: The asset’s RSI curve is currently trading at 69.44, indicating that it is in the overbought zone. The RSI curve’s value has increased as the value of tokens has increased. The RSI curve has crossed over the 14 SMA, indicating that the market is bullish. The token is facing resistance near $1.037 and we can see a strong bearish candle has formed and the value of RSI curve is dropping. If the token is rejected and continues to fall, the value of the RSI curve may fall even further.
Analyst view & Expectations
On a daily time frame, the token is trading above the 50 EMA, with bulls driving up the price. Investors are advised to wait for the token to give closing above $1.037 resistance level to get more clarity on the direction of trend. Intraday traders, on the other hand, have a good opportunity to go long if the token breaks above the resistance level or short if the token is rejected at the resistance level.
According to our current EOS price prediction, the value of EOS is expected to climb by 0.23% in the coming days, reaching $ 1.031575. Our technical indicators indicate that the current sentiment is bearish, with the Fear & Greed Index reading 51. (Neutral). Over the previous 30 days, EOS has 15/30 (50%) green days and 6.14% price volatility. According to our EOS forecast, now is not the time to buy EOS.
Technical Levels
Major support: $0.947
Major resistance: $1.197 & 200 EMA on daily time frame
Conclusion
With the price forming a bullish chart pattern, the token is gaining traction and showing bullish momentum. Investors should wait for a clear indication before investing.
Disclaimer: The views and opinions stated by the author, or any people named in this article, are for informational ideas only, and they do not establish the financial, investment, or other advice. Investing in or trading crypto assets comes with a risk of financial loss.

Andrew is a blockchain developer who developed his interest in cryptocurrencies while pursuing his post-graduation major in blockchain development. He is a keen observer of details and shares his passion for writing, along with coding. His backend knowledge about blockchain helps him give a unique perspective to his writing skills, and a reliable craft at explaining the concepts such as blockchain programming, languages and token minting. He also frequently shares technical details and performance indicators of ICOs and IDOs.


