
 Home
Home News
News
- The token has shown bearish actions in the previous sessions.
- The pair of AAVE/USDT is trading at the price level of $78.9 with a decrease of -3.56% in the past 24 hours.
AAVE (Aave) token is an Ethereum-based decentralized lending network. It enables users to lend and borrow cryptocurrency in an untrustworthy and decentralized manner. The token is facing rejection from the long term trend line and is forming strong bearish candles on a daily time frame.
AAVE on the daily time frame
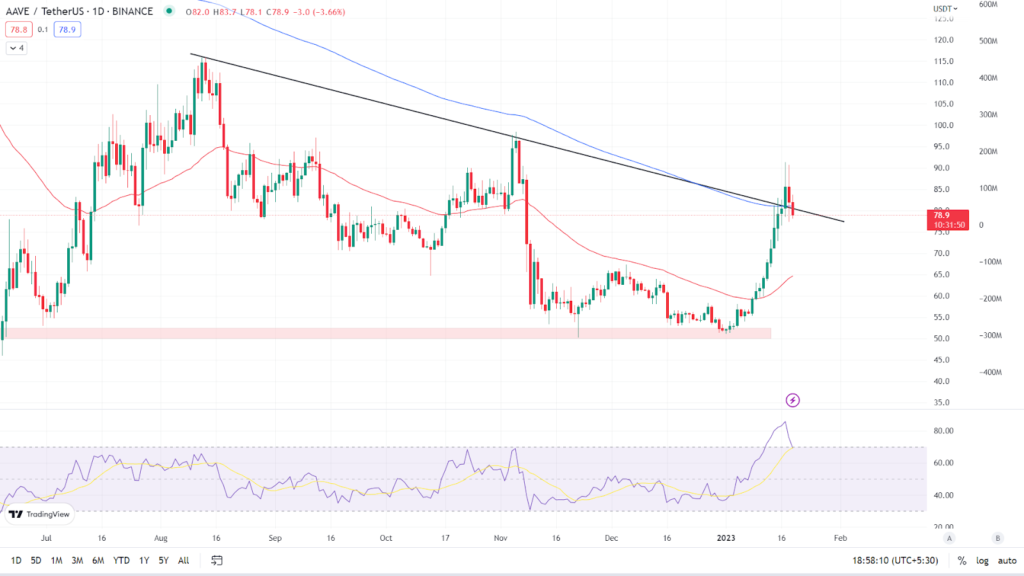
The token recently tried to break above the long term trend line but was unable to do so. According to the daily chart, AAVE token is currently trading at $78.9, indicating a -3.56% loss in the last 24 hours. It is trading between its two key Moving Averages, the 50 EMA and the 200 EMA. (Red line is 50 EMA and the blue line is 200 EMA). The token was unable to sustain above the 200 EMA and is now forming a strong bearish candle.
Relative Strength Index: The asset’s RSI curve is currently trading at 70.71, indicating that it is in the overbought zone. The rise in the price of the token led the value or RSI curve to climb, but the current price drop caused the value of RSI to fall. The RSI curve has crossed above the 14 SMA. If the token continues to be declined and its price falls, the value of the RSI curve will fall even further.
Analyst view & Expectations
The AAVE token has shown bullish momentum in the past few days, but has been unable to sustain above the 200 EMA and long term trend line. Investors are advised not to buy at this time since the token has not been able to sustain itself and is producing a strong bearish candle. Intraday traders, on the other hand, have a good opportunity to go short and book profits based on their risk to reward ratio.
According to our current Aave price prediction, the value of Aave is expected to fall by -3.54% and hit $ 76.53 in the coming days. Our technical indicators indicate that the current sentiment is bearish, with the Fear & Greed Index reading 45. (Fear). Over the previous 30 days, Aave had 21/30 (70%) green days and 15.88% price volatility. According to our Aave forecast, now is not a good time to buy Aave.
Technical Levels
Major support: $66.3
Major resistance: $96.2
Conclusion
According to the price action, the token was unable to sustain the breakout and is forming a bearish chart pattern. It remains to be seen if the token price can rebound from the long-term demand zone or break through and fall. Investors should wait for a clear indication before acting.
Disclaimer: The views and opinions stated by the author, or any people named in this article, are for informational ideas only, and they do not establish the financial, investment, or other advice. Investing in or trading crypto assets comes with a risk of financial loss.

Andrew is a blockchain developer who developed his interest in cryptocurrencies while pursuing his post-graduation major in blockchain development. He is a keen observer of details and shares his passion for writing, along with coding. His backend knowledge about blockchain helps him give a unique perspective to his writing skills, and a reliable craft at explaining the concepts such as blockchain programming, languages and token minting. He also frequently shares technical details and performance indicators of ICOs and IDOs.


