
 Home
Home News
News

- Token has shown bearish actions in previous sessions.
- The pair of ATOM/USDT is trading at the price level of $12.107 with a decrease of -0.42% in the past 24 hours.
ATOM has the potential to be a highly lucrative and long-term source of income if you plan all of your investments carefully and strategically. As a miner or regular investor in the currency, ATOM might be a feasible investment option in the long run.

Cosmos Hub (ATOM) on the daily chart
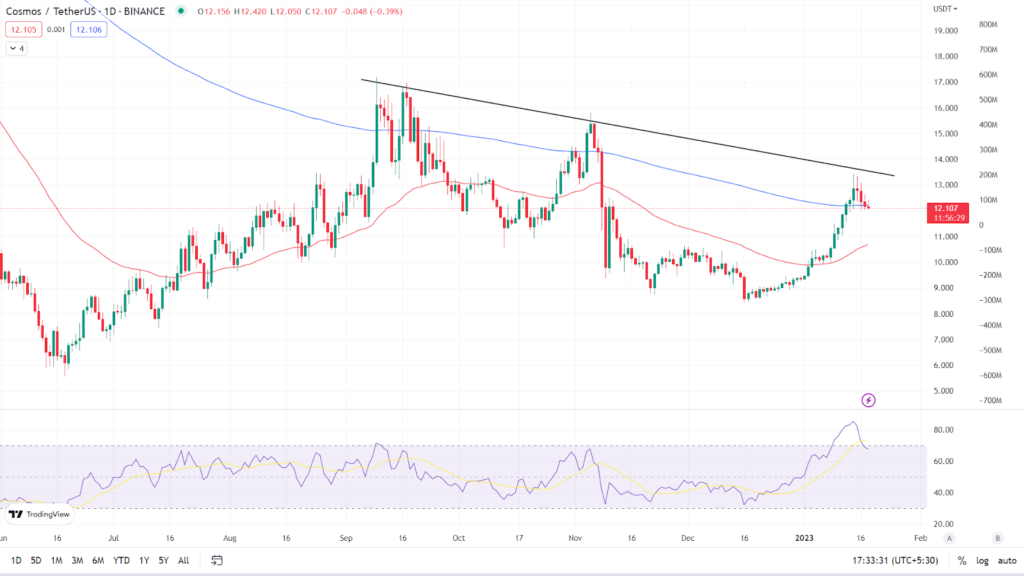
Token has shown strong signs of bullish momentum, with bulls driving up the token’s price. According to the daily chart, ATOM token is currently trading at $12.107, a loss of -0.42% in the last 24 hours. It is trading between its key Moving Averages, which are the 50 EMA and the 200 EMA. (Red line is 50 EMA and the blue line is 200 EMA). The token is facing resistance around the long term trend and is forming a strong bearish candle near the trend line.

Relative Strength Index: The asset’s RSI curve is currently trading at 68.58, indicating that it is in the overbought zone. The rise in token price has increased the value of the RSI curve. However, the recent price rejection from the trend line has led the RSI curve’s value to drop. The RSI curve has crossed below the 14 SMA, indicating bearishness.
Analyst view & Expectations
To continue the uptrend, the token must hold above the 200 EMA and break the trend line upward with high volume. To get confirmation on the uptrend, investors should wait for the token to break the trend line and sustain above it on a daily time frame. Intraday traders, on the other hand, have a good opportunity to go long when the token breaks above the trend line and book profits based on their risk to reward ratio.
According to our current Cosmos (ATOM) price prediction, the value of Cosmos (ATOM) is expected to climb by 1.59% in the next few days, reaching $ 12.37. Our technical indicators indicate that the current sentiment is bearish, with the Fear & Greed Index reading 52. (Neutral). Over the previous 30 days, Cosmos has 20/30 (67%) green days and 12.75% price volatility. According to our Cosmos forecast, now is not the time to buy Cosmos.
Technical Levels
Major support: $11.21
Major resistance: $13.27
Conclusion
The token showed strong bullish momentum but was not able to break through the trend line. Before breaking the trend line, the token may have a small retracement. Before investing, investors should wait for a clear indication.
Disclaimer: The views and opinions stated by the author, or any people named in this article, are for informational ideas only, and they do not establish the financial, investment, or other advice. Investing in or trading crypto assets comes with a risk of financial loss.

Andrew is a blockchain developer who developed his interest in cryptocurrencies while pursuing his post-graduation major in blockchain development. He is a keen observer of details and shares his passion for writing, along with coding. His backend knowledge about blockchain helps him give a unique perspective to his writing skills, and a reliable craft at explaining the concepts such as blockchain programming, languages and token minting. He also frequently shares technical details and performance indicators of ICOs and IDOs.


