
 Home
Home News
News

- KSM coin price reclaimed 50 day EMA and gives hope to the bullish investors
- Kusama price formed a double bottom pattern and bulls succeeded to breakout of the neckline resistance at $32.00
- KSM crypto technical indicators are turning bullish but RSI entered overbought zone
Kusama crypto price is trading with mild bullish cues and buyers are trying to hold the prices above the breakout level at 31.00 to show its presence at lower levels. However the prices are near to supply zones which may create trouble for short term traders. Currently, the pair of KSM/USDT is trading at $36.53 with an intraday gains of 0.88% and the 24-hour volume to market cap ratio at 0.0934

KSM price followed the market sentiment
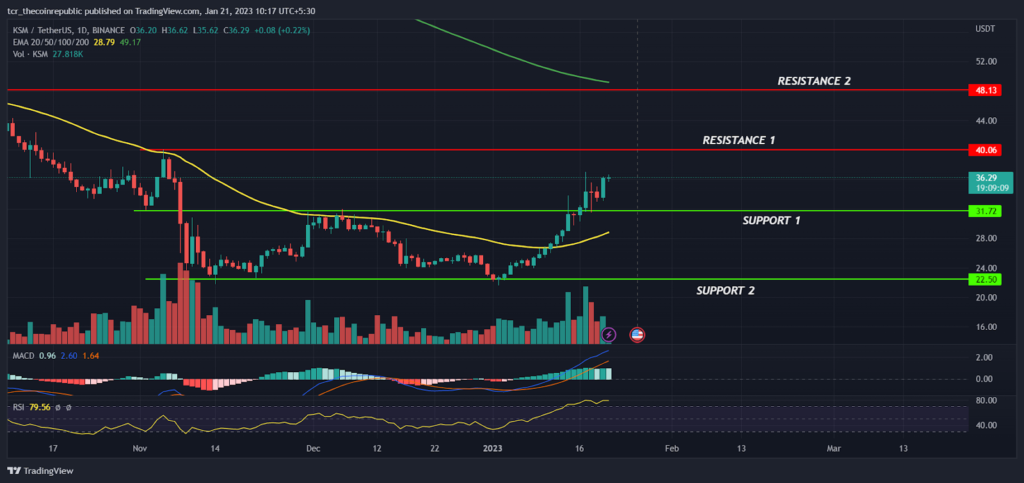
On a daily time frame, KSM coin price had shown surprising recovery from the 52 week low at $21.61 and reversing upward while forming higher high candles. In December bulls gained some positive momentum and attempted to break out of the above 50 day EMA but unfortunately $31.00 acted as a strong resistance and prices dragged down to the demand zone.

Kusama coin prices took support at the demand zone and reversed upwards by forming a double bottom pattern indicating some genuine buyers are active at lower levels and trying to keep the prices above the $22.00 level. Later, the market sentiment improved and bulls succeeded to reclaimed above the 50 day EMA (yellow) and broke out the neckline resistance with the higher volume denoting the confidence of buyers is coming back and investors are expecting outperformance in the coming months. However, on the higher side, $40.00 will act as an immediate hurdle for bulls followed by the next hurdle at $48.00 level.
KSM technical indicators are turning bullish and buyers are trying to reverse the trend in the favor of bulls. However, the RSI curve (79) entered into the overbought zone and if any minor corrections trigger from the supply zones then the $30.00 will act as an immediate support level for bulls followed by next support at $22.00 level. The MACD has generated a positive crossover indicating the bullishness may continue in the coming days and short term correction will prove an opportunity for investors to accumulate at lower levels.
Summary
KSM prices had shown sharp recovery of 60% from the recent lows and bulls succeeded in holding the prices above the 50 day EMA shows the confidence of buyers at lower levels. However, the prices are heading towards the supply zone and may consolidate for sometime before continuing the upwards momentum. Therefore, aggressive traders may look for buy on dip opportunities near to support zones for the target of $40.00 and above by keeping $26.00 as SL. On the other hand, if prices slipped below $22.00 we may see a downside expansion.
Technical levels
Resistance levels : $40.00 and $48.00
Support levels : $28.00 and $22.00
Disclaimer
The views and opinions stated by the author, or any people named in this article, are for informational purposes only, and they do not establish financial, investment, or other advice. Investing in or trading crypto assets comes with a risk of financial loss.

Nancy J. Allen is a crypto enthusiast, with a major in macroeconomics and minor in business statistics. She believes that cryptocurrencies inspire people to be their own banks, and step aside from traditional monetary exchange systems. She is also intrigued by blockchain technology and its functioning. She frequently researches, and posts content on the top altcoins, their theoretical working principles and technical price predictions.


