
 Home
Home News
News

- Comcast stock price is up by 15% and formed a bullish reversal pattern on the monthly basis
- Comcast stock price broke out 200 day EMA and reversed the positional trend in the favor of bulls
- Comcast stock technical turning bullish and the RSI entered the overbought zone
Comcast stock is trading with the bullish cues and bulls are trying to reverse the positional trend by keeping the price above the 200 day EMA. However it will be interesting to see how prices react in the supply zone. Currently, NASDAQ : CMCSA stock price is trading at $40.26 with the intraday gains of 2.26% and market cap stood at $174.06B

Good time to accumulate the Comcast stock ?
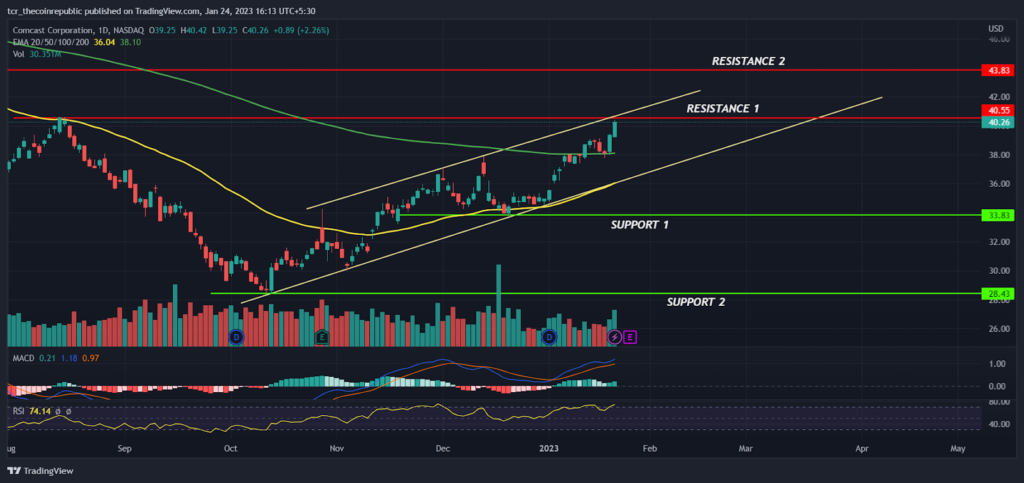
On the daily time frame, Comcast Corporation stock price is rising upward in the positive parallel channel and succeeded to reclaim the 200 day EMA which shows that the positional trend is reversing in the favor of bulls but the confirmation is awaited because price is near to the supply zone and may face rejection in the coming sessions.

The hurdle zone for the stock will be at $40.55 and $43.83 level and it is expected that the price is likely to consolidate on the higher levels before deciding the further direction.
The CMCSA stock is up by15% approx on the monthly basis which shows that the genuine buyers are coming back and expecting more upwards momentum in the coming months. However, the fundamentals of the company are not up to mark and the company seems to be struggling to keep the net income positive. According to the data in the Yahoo finance, average revenue estimates of the next quarter (mar 2023) stood at $29.53B and the EPS trend stands at 0.9
The Comcast stock technicals are turning bullish but it is difficult to say how price will react in supply zones in the coming sessions. However, if any correction triggers from the higher levels prices are likely to hold the support level of $33.00. The MACD had generated a positive crossover indicating the strength of bulls and the RSI at 74 sloping upwards denotes price may soon enter into the overbought level.
Summary
The comcast stock price is rising upward in the positive parallel channel and bulls have succeeded to take out the 200 day EMA which indicates the confidence of buyers is returning back. The technical analysis suggests that prices are in buyers grip but if market sentiment turns negative then we can see minor correction or consolidation in the coming days. Therefore, it’s better to look for buy when price retrace towards 50 day EMA for the target of $44.00 keeping $33.00 as SL. However if price drops below $33.00 bear’s can drag it down towards $28.00 level.
Technical levels
Resistance levels : $43.50 and $48.00
Support levels : $33.00 and $28.00
Disclaimer
The views and opinions stated by the author, or any people named in this article, are for informational ideas only, and they do not establish financial, investment, or other advice. Investing in or trading crypto assets comes with a risk of financial loss.

Nancy J. Allen is a crypto enthusiast, with a major in macroeconomics and minor in business statistics. She believes that cryptocurrencies inspire people to be their own banks, and step aside from traditional monetary exchange systems. She is also intrigued by blockchain technology and its functioning. She frequently researches, and posts content on the top altcoins, their theoretical working principles and technical price predictions.


