
 Home
Home News
News
- Compound token price reclaimed 50-day EMA but struggles to hold the 200-day EMA
- Comp price took a halt at $55 and is forming a rejection candle
- Comp token technically are turning bearish but the price action is still in the favor of bulls
Compound crypto price is trading with bullish cues and buyers are trying to break out of the 200-day EMA hurdle for confirming the bullish trend reversal on a positional basis. However, the price action looks sluggish and stuck in the range. Currently, the pair of COMP/USDT is trading at $49.11 with intraday gains at 1.99% and the 24-hour volume to market cap ratio at 0.076
Will the COMP price continue the upward rally?
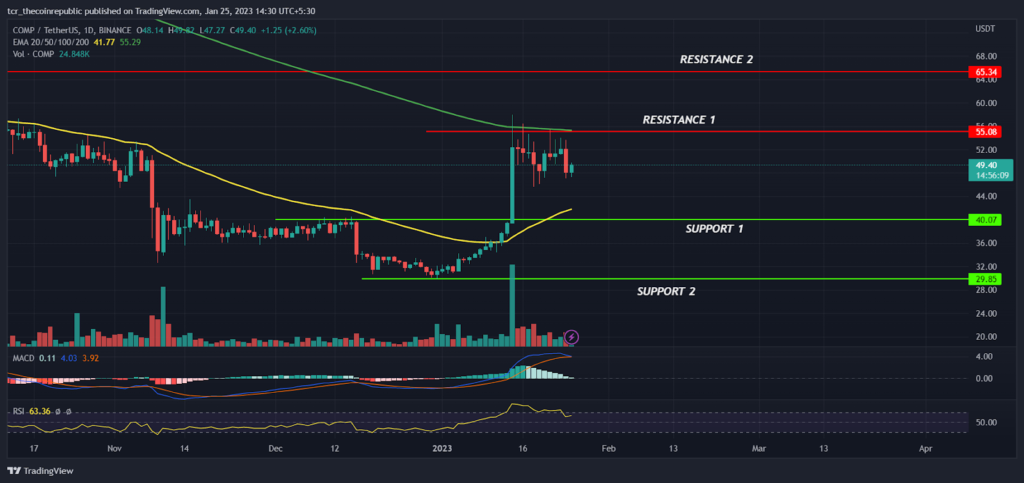
On a daily time frame, Compound token price is consolidating near the supply zone and forming long tail rejection candles, which indicates that the bears are active on the higher levels. Recently, in the mid of January, Comp prices broke out from the narrow range consolidation with a giant bullish candle which had derived the positive sentiment and price shot up 38% on an intraday basis but unfortunately prices lack the follow-up movement and 200-days EMA becomes the barrier for the bulls.
Comp token price had succeeded to reclaim above the 50-day EMA, which shows that the short-term trend has reversed in the favor of bulls. But it seems like the price lacked momentum on the higher levels and is expected to consolidate for some more time before deciding the further direction. On the higher side $55.00 mark is acting as an immediate hurdle for bulls and if bulls succeed to break out of this immediate hurdle then it can rally towards $65.00 in a short span of time.
The technical indicators of the comp token are turning bearish but the price action seems to still be in the favor of bulls. However, if any corrections trigger from the higher levels, then the $40.00 will be acting as a savior for bulls. The MACD is on the way to generate a negative crossover which may create trouble for bulls and the RSI curve at 63 denotes the price might test the overbought level.
Summary
The compound price had broken out from the narrow range consolidation and shot up by 38% on a single day, which has created hope of bullish traders but unfortunately, the price lacked momentum near the supply zone and was expected to consolidate for some time.
The technical analysis suggests that prices are into bulls grip and any minor sell off will provide an opportunity to accumulate at the lower levels. Therefore, traders may look for buying near the support levels for the target of $65.00 by keeping $35.00 as SL. However, if the price slips below $35.00 bears can try to drag it further down towards $30.00 levels
Technical levels
Resistance levels: $55.00 and $65.00
Support levels: $40.00 and $30.00
Disclaimer
The views and opinions stated by the author, or any people named in this article, are for informational purposes only, and they do not establish financial, investment, or other advice. Investing in or trading crypto assets comes with a risk of financial loss.

Nancy J. Allen is a crypto enthusiast, with a major in macroeconomics and minor in business statistics. She believes that cryptocurrencies inspire people to be their own banks, and step aside from traditional monetary exchange systems. She is also intrigued by blockchain technology and its functioning. She frequently researches, and posts content on the top altcoins, their theoretical working principles and technical price predictions.


