
 Home
Home News
News
- The coin is presently trading around its 50 EMA (the blue line).
The coin has shown a bull move in recent days after hitting its support level and now the price has gone into a consolidation zone. After the breakout of the current consolidation zone we may see a bullish move.
Zilliqa on daily time frame
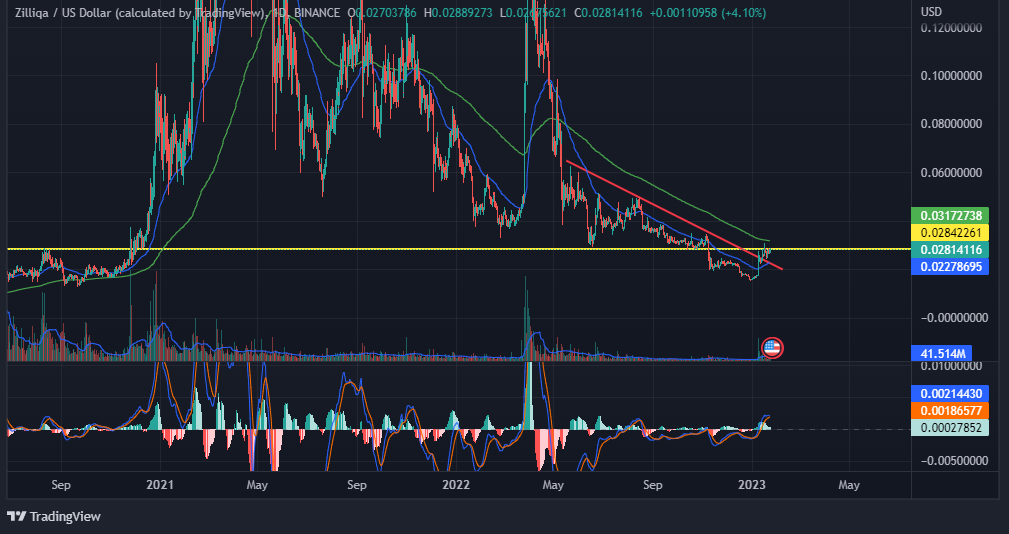
The horizontal line on the daily chart is a line which shows that price has resisted these levels several times. Therefore, if we see price moving above the horizontal line we may consider it as a horizontal line breakout and then a good bullish move can be seen to its next near resistance i.e. $0.03919091.
MACD – Bullish cross has been formed by MACD. The MACD’s bullish crossover on Zilliqa daily chart indicates an uptrend.
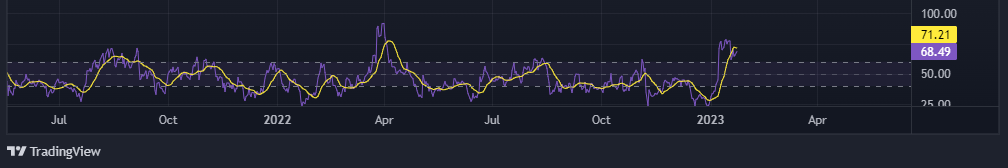
Relative Strength Indicator (RSI) – The relative strength indicator shows that the RSI curve has crossed the 50-point mark at 71.21. The RSI curve’s value has increased as a result of the increase in oin’s value. The RSI curve might rocket even higher if the prices rise considerably more.
Analyst views and expectations
We may witness a short bullish move in the upcoming days which short-term investors can look to capture. As far as long-term investors are concerned the coin does not look a good investment option for them. Hence they should wait until a Golden Crossover occurs.
A very erratic short-term zilliqa price forecast from CoinCodex for 2023 suggested that the coin may fall to $0.0246 by January 14 before rising to $0.0280 by February 9.Perhaps appropriately, the technical analysis of the website was impartial with 19 indicators producing bullish signs and 14 producing bearish signals.
Zilliqa coin price predictions from DigitalCoinPrice stated that the coin might hit $0.0872 by 2025.The website then projected the price of zilliqa for 2030 estimating that it might reach $0.26.
By the end of 2023,Zilliqa price is expected to reach $0.026 by CryptoPredictions. The website then forecast the price of zilliqa for 2025 predicting that the cryptocurrency would begin the year at $0.0402 and end it at $0.0477.
Last but not least, WalletInvestor predicted that the price of zilliqa cryptocurrency would drop to $0.00156 by January 2024 indicating that the coin would have a difficult year.
Technical Levels
Major resistance -$0.08102652
Major support -$0.01477963
Conclusion
The coin looks good for short-term investing but for long-term one should avoid investing in Zilliqa.
Disclaimer: The opinions represented in this work along with any other opinions are presented primarily for informative purposes and are not intended to be taken as investment advice.

Andrew is a blockchain developer who developed his interest in cryptocurrencies while pursuing his post-graduation major in blockchain development. He is a keen observer of details and shares his passion for writing, along with coding. His backend knowledge about blockchain helps him give a unique perspective to his writing skills, and a reliable craft at explaining the concepts such as blockchain programming, languages and token minting. He also frequently shares technical details and performance indicators of ICOs and IDOs.


