
 Home
Home News
News

- Chainlink joins the group of most traded smart contracts among the top ETH whales.
- Chainlink Economics 2.0 to mark a new era for the network.
- Network’s social volume has reached all-time highs.
Chainlink has entered the list of most used smart contracts among the top 1,000 ETH whales in the last week. This listing hints towards the heavy utility of the network. Adding to it, Chainlink’s social volume has reached all-time highs. Chainlink’s Proof of Reserve is used by stablecoins, wrapped tokens and blockchain bridges to increase transparency on the reserves underlying new on-chain assets.

Chainlink’s Proof of Reserve received the spotlight in the aftermath of the FTX debacle, where the holders demanded proof of their reserves and utmost transparency. Furthermore, Chainlink Economics 2.0 is set to mark a new era for the network.

The facility provides features like build, scale and staking, which increase oracle security, fuel Web3 innovation and expand value capture for Chainlink service providers. In response to this, LINK showed bullish signals but wasn’t strong enough to hold it for long. These futuristic attributes might contribute to extending the rally.
The Price Chain
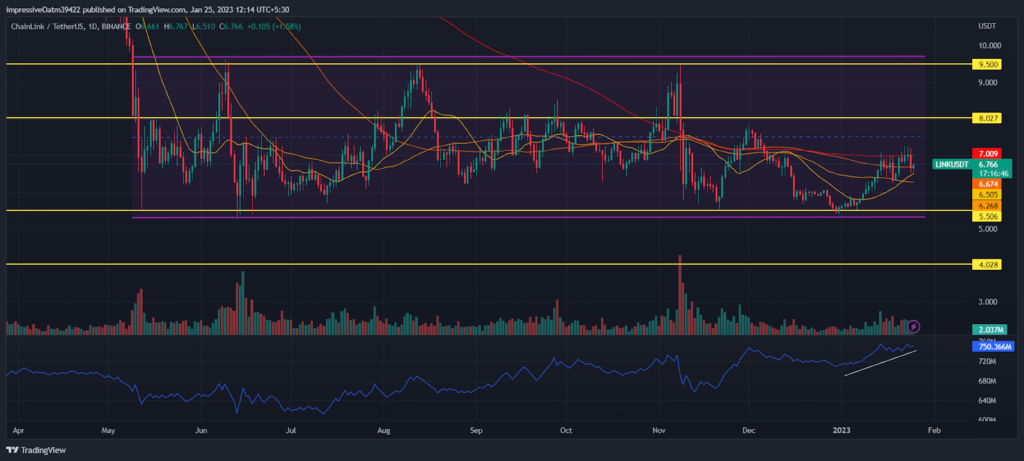
The LINK prices moved forming a parallel channel, with current price action occurring in the lower half of the channel. The price movement has captured all significant EMAs, with a bullish crossover. The recent volume recorded shows active buyers. The uptick in OBV suggests the pressure in the market to be positive. The price has tested the support range of $5.5 several times.
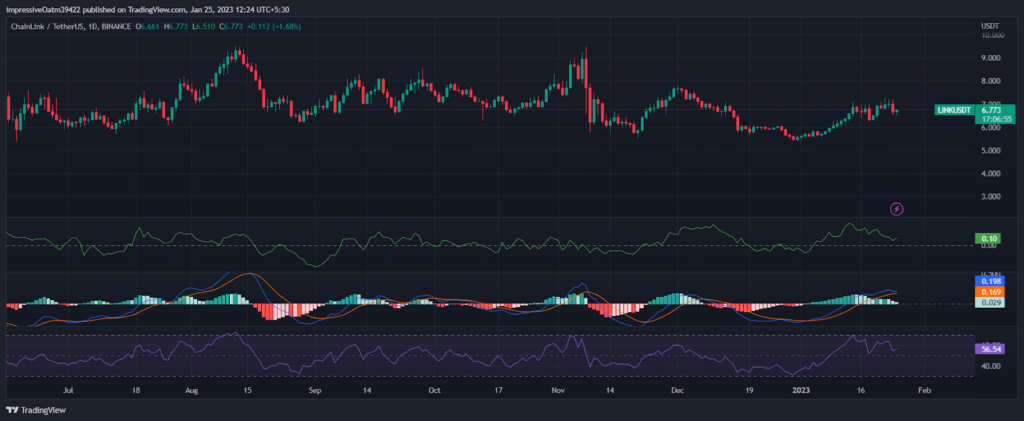
The CMF moves in the positive zone to mark the optimistic momentum in the prices. The MACD records buyer-regime while the lines split and the bars stand tall above the zero-histogram mark. The RSI bounces within the upper half ranges to reflect the buyer pull.
A Closer Look
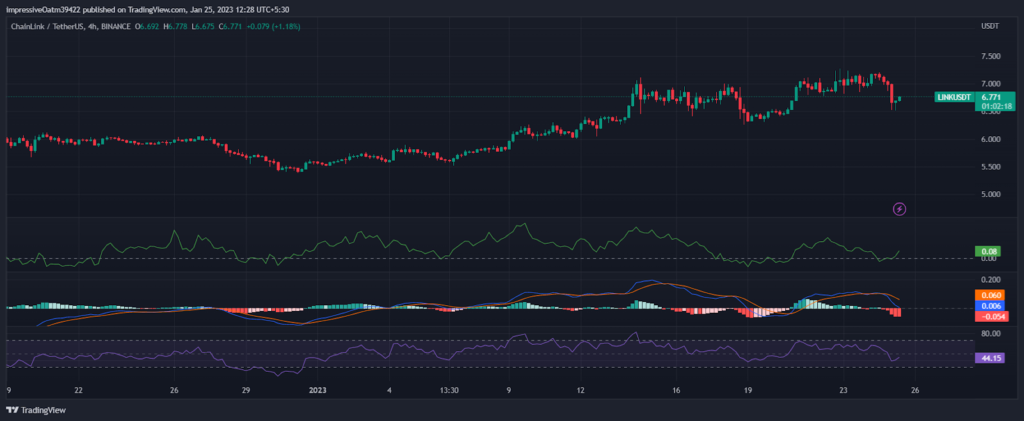
The smaller time frame shows prices facing the seller’s resistance. The CMF bounces back to rise in the positive zone from the baseline. The MACD records a few sellers trying to control the market and competing with proactive sellers. The RSI retraces from the ranges below the half line to mirror the buyer’s influence.
Conclusion
The network embarks to make several amends that will benefit in the long term. Many analysts anticipate the token to be suitable for long-term investments and reaching new highs. The holder must keep a keen watch on the resistance and support levels to witness the price rocket.
Technical levels
Support levels: $5.5 and $4.0
Resistance levels: $8.0 and $9.5
Disclaimer
The views and opinions stated by the author, or any people named in this article, are for informational purposes only, and they do not establish financial, investment, or other advice. Investing in or trading crypto assets comes with a risk of financial loss.

Andrew is a blockchain developer who developed his interest in cryptocurrencies while pursuing his post-graduation major in blockchain development. He is a keen observer of details and shares his passion for writing, along with coding. His backend knowledge about blockchain helps him give a unique perspective to his writing skills, and a reliable craft at explaining the concepts such as blockchain programming, languages and token minting. He also frequently shares technical details and performance indicators of ICOs and IDOs.


