
 Home
Home News
News
- The token is trading above the 50 EMA on the daily time frame.
- The pair of STX/USDT is trading at the price level of $0.284 with a gain of 2.86% in the past 24 hours.
On a daily time frame, the STACKS (STX) token is trading below the demand zone. The token is in a long-term downtrend, with bears pushing the price down and forming lower highs and lower lows.
STX on the daily chart
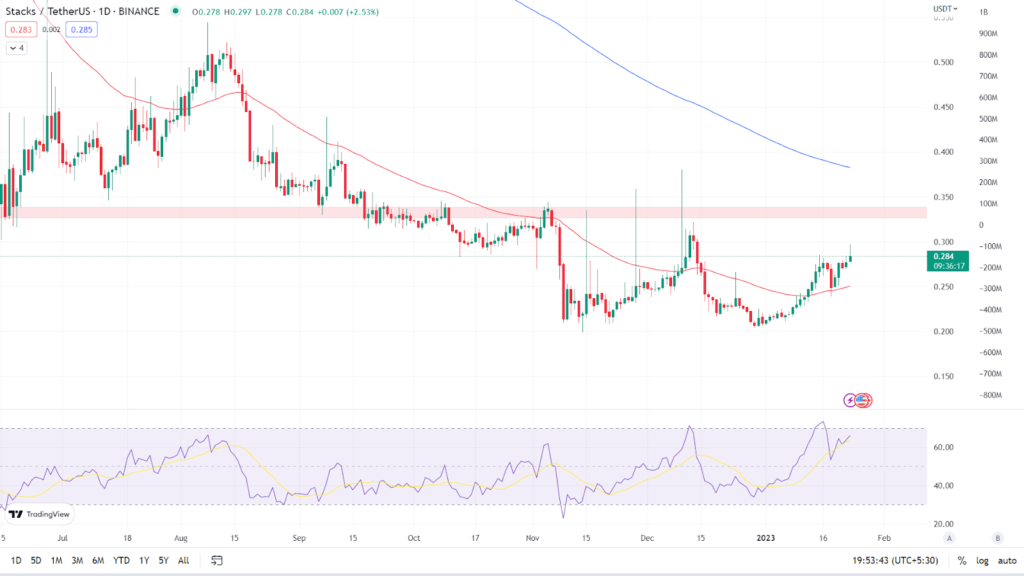
The overall outlook for the token is bearish, with the bears rejecting all of the bulls’ highs. The daily chart shows that STX token is currently trading at $0.284 with a gain of 2.86% in the last 24 hours. In the daily time frame, the token has crossed and sustained above the 50 EMA, and it is currently trading between its key Moving Averages, the 50 EMA and the 200 EMA. (Red line is 50 EMA and the blue line is 200 EMA).
Relative Strength index: The token’s RSI curve is currently trading at 66.56, indicating that it is in the overbought zone. The bullish momentum over the past few days has increased the value of the RSI curve. The RSI curve has crossed the 14 SMA upward indicating that the market is bullish. If the bulls continue their momentum, the value RSI curve will increase even further.
Analyst view & Expectations
The token recently took a pullback or support from the 50 EMA and has continued the uptrend, forming strong bullish candles on the daily time frame. Investors can buy now to reach the short-term target of $0.326 or the 200 EMA. Intraday traders, on the other hand, have a good opportunity to go long and aim for $0.326. If the token is rejected from the demand zone and forms a strong bearish candle, they can go short and book profit as per their risk/reward ratio.
According to our current Stacks price prediction, the value of Stacks will fall by -10.49% and hit $ 0.256354 in the coming days. Our technical indicators indicate that the current sentiment is Neutral, with the Fear & Greed Index reading 50. (Neutral). Over the previous 30 days, Stacks had 19/30 (63%) green days with 9.54% price volatility. According to our Stacks forecast, now is a good time to buy Stacks.
Technical Levels
Major support: $0.244
Major resistance: $0.338
Conclusion
The token’s overall outlook is bearish, although in recent days it has shown signs of bullish momentum and is gaining traction. It has to be seen whether the token’s momentum will continue or whether the bears will overpower the bulls.
Disclaimer: The views and opinions stated by the author, or any people named in this article, are for informational ideas only, and they do not establish the financial, investment, or other advice. Investing in or trading crypto assets comes with a risk of financial loss.

Nancy J. Allen is a crypto enthusiast, with a major in macroeconomics and minor in business statistics. She believes that cryptocurrencies inspire people to be their own banks, and step aside from traditional monetary exchange systems. She is also intrigued by blockchain technology and its functioning. She frequently researches, and posts content on the top altcoins, their theoretical working principles and technical price predictions.


