
 Home
Home News
News
- The token has shown bullish actions in the previous sessions.
- The pair of GT/USDT is trading at the price level of $4.0365 with a decrease of -0.68% in the past 24 hours.
Bulls are fighting bears and are currently outplaying them as they drive up the price of the token. On the daily chart, we can see that strong bullish candles are forming showing strong bullish momentum.
Gate Token (GT) on the daily chart
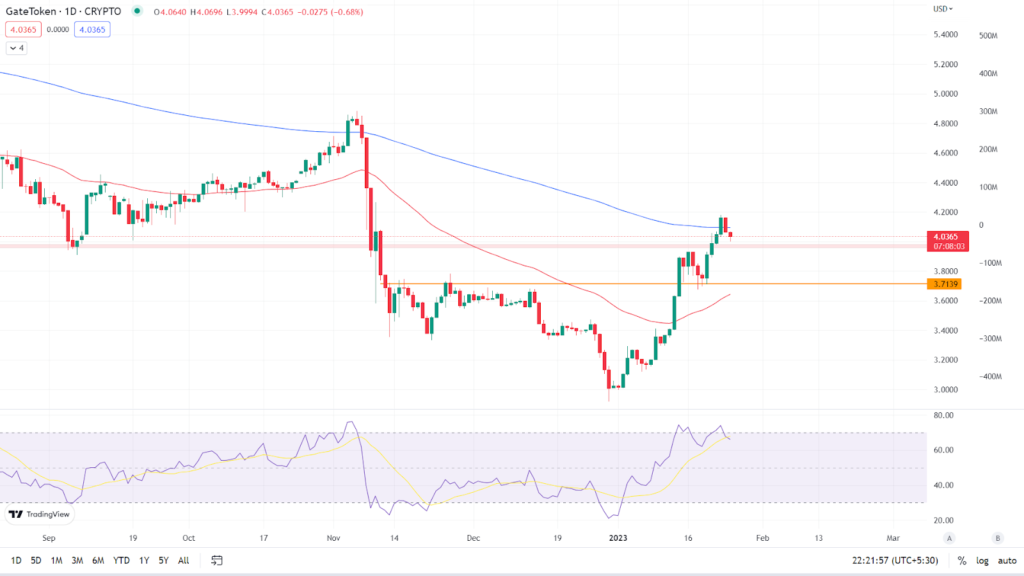
The token has taken a small pullback on the resistance level and has continued uptrend and has crossed above the demand zone and sustained on the daily time frame. According to the daily chart, GT token is currently trading at $4.0365, indicating a loss of -0.68% in the last 24 hours. It is trading between its two key Moving Averages, the 50 EMA and the 200 EMA. (Red line is 50 EMA and the blue line is 200 EMA). On the daily time frame, the token is currently facing resistance at the 200 EMA.

Relative Strength Index: The asset’s RSI curve is currently trading at 66.59, indicating that it is in the overbought zone. The recent increase in the token price has increased the value of the RSI curve. Because of the current bearishness, the RSI curve has crossed below the 14 SMA. If the bulls can continue their bullish momentum and increase the price of the token, the RSI curve will remain in the overbought zone.
Analyst view & Expectations
The token has often faced resistance at the 200 EMA on the daily time frame and has been unable to cross and sustain above it. Investors who are willing to take a risk can buy now because the token is on a bullish trend, while those who like to trade safely can wait for the token to cross and sustain above the 200 EMA on a daily time frame. Intraday traders, on the other hand, have a good opportunity to go long whenever the token breaks over the 200 EMA and book profits based on their risk to reward ratio.
According to our current GateToken price projection, the value of GateToken will fall by -12.17% and hit $ 3.55 in the coming days. Our technical indicators indicate that the current sentiment is bearish, with the Fear & Greed Index reading 51. (Neutral). Over the previous 30 days, GateToken had 16/30 (53%) green days and 9.91% price volatility. According to our GateToken forecast, now is not the time to buy GateToken.
Technical Levels
Major support: $3.9563
Major resistance: $4.2802
Conclusion
According to the price action, the token has shown strong bullish momentum, with bulls driving up the price and forming a bullish chart pattern. It remains to be seen whether the token can break above the 200 EMA on a daily chart.
Disclaimer: The views and opinions stated by the author, or any people named in this article, are for informational ideas only, and they do not establish the financial, investment, or other advice. Investing in or trading crypto assets comes with a risk of financial loss.

Andrew is a blockchain developer who developed his interest in cryptocurrencies while pursuing his post-graduation major in blockchain development. He is a keen observer of details and shares his passion for writing, along with coding. His backend knowledge about blockchain helps him give a unique perspective to his writing skills, and a reliable craft at explaining the concepts such as blockchain programming, languages and token minting. He also frequently shares technical details and performance indicators of ICOs and IDOs.


