
 Home
Home News
News

- The token is trading above the demand zone on the daily time frame.
- The pair of AR/USDT is trading at the price level of $10.130 with a decrease of -2.12% in the past 24 hours.
The Arweave (AR) token was in a long-term downtrend, with bears pushing the token’s price lower. The token has shown bullish momentum in recent days but is yet to break through the resistance level.

Arweave token on the daily chart
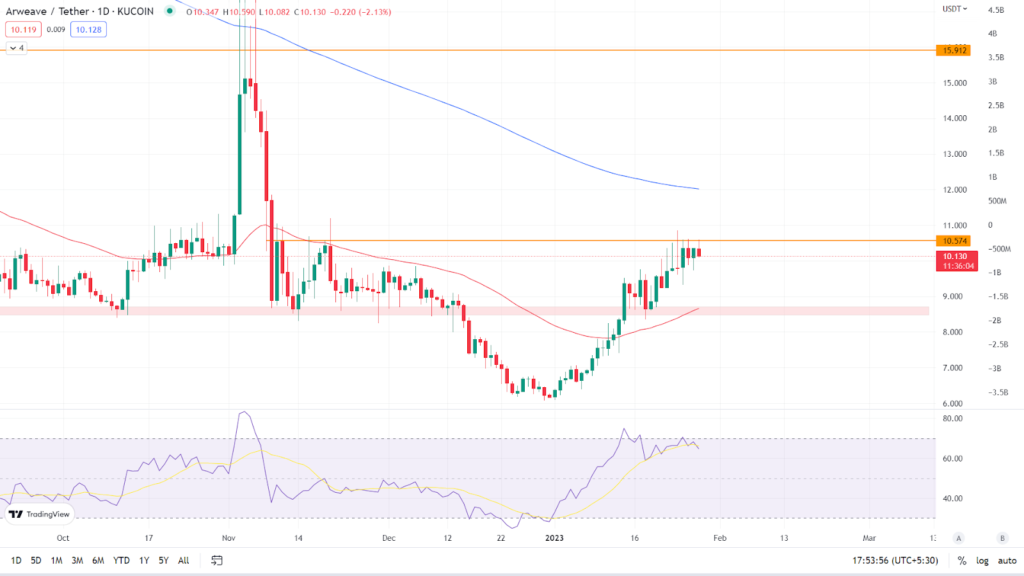
On the daily time frame, the token has crossed above the demand zone, but is now facing resistance at $10.574. According to the daily chart, Arweave token is currently trading at $10.130, indicating a -2.12% decrease in the last 24 hours. The token has crossed and sustained above the 50 EMA, and it is currently trading between its key Moving Averages, the 50 EMA and the 200 EMA. (Red line is 50 EMA and the blue line is 200 EMA). It remains to be seen if the token can break through the resistance level and continue the bullish momentum.

Relative Strength Index: The RSI curve of the asset is currently trading at 64.31 and the value is declining as the token has started to consolidate below the resistance level on the daily time frame. The RSI curve has crossed the 14 SMA downward. If the bulls are not able to break through the resistance level and continue the bullish momentum the value of the RSI curve may drop even further.
Analyst view & Expectations
The token retraced to the demand zone before continuing its bullish trend. Investors who missed the entry during the pullback should wait for the token to break and sustain above the resistance level on the daily time frame to confirm the trend’s direction. Intraday traders, on the other hand, have a good opportunity to go long once the token breaks over the resistance level and book profits based on their risk to reward ratio.
According to our current Arweave price projection, the value of Arweave is expected to climb by 1.95% over the next few days, reaching $ 10.31. Our technical indicators indicate that the current sentiment is Neutral, with the Fear & Greed Index reading 52. (Neutral). Over the previous 30 days, Arweave had 21/30 (70%) green days and 16.99% price volatility. According to our Arweave forecast, now is not the time to buy Arweave.
Technical Levels
Major support: $9.690
Major resistance: $10.574
Conclusion
The token has shown bullish momentum in the past few days with bulls driving up the price of the token forming a bullish chart pattern as per the price action. It remains to be seen if the token can break above the resistance level and continue the bullish momentum.
Disclaimer: The views and opinions stated by the author, or any people named in this article, are for informational ideas only, and they do not establish the financial, investment, or other advice. Investing in or trading crypto assets comes with a risk of financial loss.

Andrew is a blockchain developer who developed his interest in cryptocurrencies while pursuing his post-graduation major in blockchain development. He is a keen observer of details and shares his passion for writing, along with coding. His backend knowledge about blockchain helps him give a unique perspective to his writing skills, and a reliable craft at explaining the concepts such as blockchain programming, languages and token minting. He also frequently shares technical details and performance indicators of ICOs and IDOs.


