
 Home
Home News
News
- SAND is in an uptrend from the past few days.
- The token shows signs of bullish move.
The token is presently at its resistance level forming a consolidated zone. The trend from the past few days on the chart shows that token has gained uptrend.
SAND on daily chart
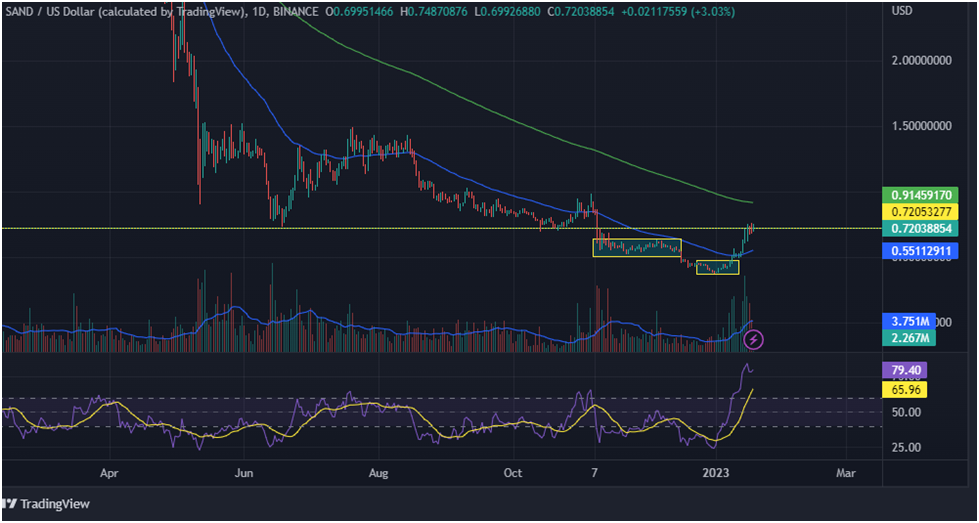
On the daily chart it is clearly visible that some consolidated zones are being formed and after each supply zone we are observing a bearish move and after each demand zone we are observing a bullish move.

We can observe the same thing happening at current levels so if a zone is formed again we may see either a bullish move or bearish move. Moreover the horizontal line on the chart shows that token has tested these levels multiple times and is now ready for a bull move to its next near resistance i.e. $0.92661458.
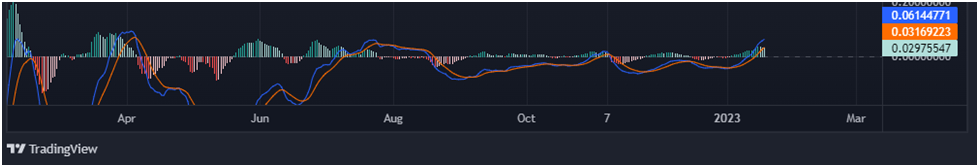
MACD – The MACD has made a bullish cross. On the daily chart of SAND, the MACD’s bullish crossover suggests a rising trend.
Relative Strength Index (RSI) – The relative strength indicator indicates that the RSI curve has crossed the 50-point threshold at 79.40 (RSI). The rise in token values has raised the value of the RSI curve. If the price increases even more, the RSI curve can rise sharply.
Analyst view and Expectations
We can see that though macd has given a bullish crossover but the histogram that is there in macd is weakening, its bars are turning light green which shows that bulls are getting weak. So if any investor invests in the token he/she should himself do a proper analysis. The chart altogether looks great for short-term investors.
According to PricePrediction, the token might cost $2.08 in 2026. Based on the forecast, the token may trade at $2.93 by 2027, rise to $4.34 the following year, and end the decade at $6.13. The Sandbox’s price may trade at an average of $8.57 in 2030 before rising to a maximum $12.09 in 2031, the website continued.
According to CaptainAltCoin’s The Sandbox price forecast for 2023, the coin may end the year at $0.7347. The website predicted that it may be worth $0.7251 by January 2024. The site predicted a $2.14 pricing for The Sandbox in 2025 before speculating that price may reach $5.34 by 2030.
In terms of its SAND price forecast, WalletInvestor was a little more pessimistic. By January 2024, the metaverse token might only cost an average of $0.0386.
Technical Levels
Major resistance -$1.44700160
Major support -$0.37052668
Conclusion
The chart looks good for short-term investors but for long term investors it doesn’t look good at present. So it is advisable that long term investors should wait for some time until there is a Golden Crossover.
Disclaimer: The opinions expressed in this article, as well as those of anyone else who is mentioned, are presented for informational purposes only and should not be construed as financial advice. You are at risk of losing money when buying or trading cryptocurrencies.

Andrew is a blockchain developer who developed his interest in cryptocurrencies while pursuing his post-graduation major in blockchain development. He is a keen observer of details and shares his passion for writing, along with coding. His backend knowledge about blockchain helps him give a unique perspective to his writing skills, and a reliable craft at explaining the concepts such as blockchain programming, languages and token minting. He also frequently shares technical details and performance indicators of ICOs and IDOs.


