
 Home
Home News
News

- ETH price sustained above 50 and 200 day EMA as well as showing signs of golden EMA crossover
- ETH price formed a bullish hammer candle on the weekly basis
Ethereum crypto price is trading with mild bearish cues and bears are trying to keep the price below $1700 level. However, the previous few sessions of ETH are in the narrow range of consolidation and probability of upside breakout increases if market sentiment remains positive. Currently, The pair of ETH/USDT is trading at $1636.20 with an intraday loss of 0.52% and the 24-hour volume to market cap ratio at 0.0399

Will the ETH price continue the upward momentum ?
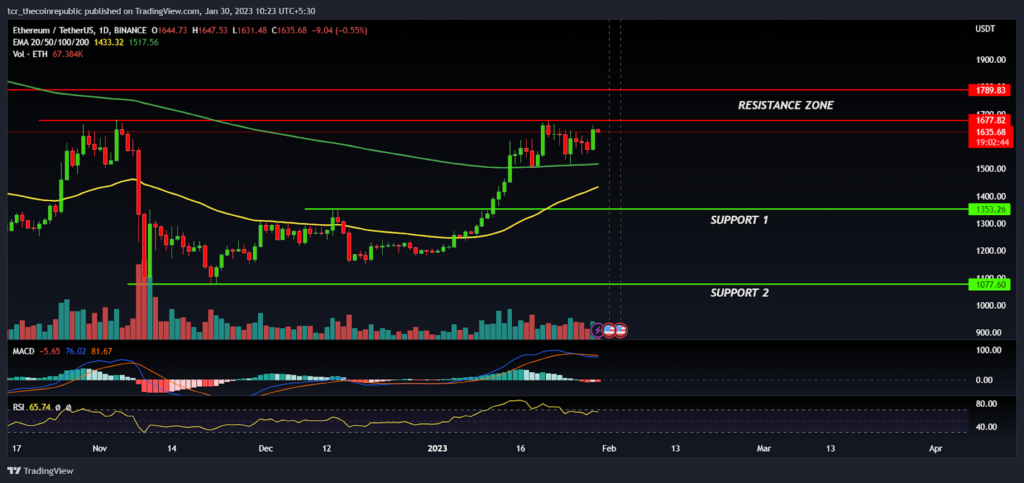
On the daily time frame, Ethereum prices are quite stable and bulls are trying to keep the price above the 200 day EMA which indicates that the positional trend is reversing in the favor of bulls.

From the past couple of days, ETH price has broken out of the 200 day EMA (green) near $1500 and entered into the narrow range consolidation between $1500.00 to $1680.00 which is likely to break on either side in the coming weeks.The probability of the upside movement is high til prices is above the short term support at $1500.00
The ETH prices are following the overall crypto market trend and if the market sentiment remains positive then the ETH price can rally towards $1800.00 in the coming months.
However, the bulls have tried multiple times to sustain above the $1800.00 but faced rejection from the higher levels which clearly shows that bear’s are dominating on the higher levels. Currently, the prices are near to the supply zone and $1700.00 will act as an immediate hurdle for the bulls.
The ETH technical indicators are mild bearish and indicate that the prices are lacking momentum on the higher levels. The MACD curve is reversing down and has generated a negative crossover, whereas the RSI curve at 65 is sloping sideways denotes prices may trade in range bound in the coming days. According to technical analysis, ETH prices may retrace towards the 50 day EMA before deciding the further direction. On the other hand, if prices slipped below the 50 day EMA then the next support level will be $1350.00 level
Summary
Ethereum price had shown a meaningful recovery from the recent lows and succeeded to hold the prices above both the important EMAs which shows the strength of bulls at the lower levels. Technical analysis suggests that ETH prices might retrace towards the 50 day EMA before deciding the further direction.
Therefore,Traders may look for buying opportunities near to EMA retracement for maintaining the better risk reward ratio and also aim for the target of $1800.00 by keeping $1350.00 as SL. However, if prices drop below $1350.00 then the trend reversal will become doubtful.
Technical levels
Resistance levels : $1789.00 and $2000.00
Support levels : $1350.00 and $1077.00
Disclaimer
The views and opinions stated by the author, or any people named in this article, are for informational purposes only, and they do not establish financial, investment, or other advice. Investing in or trading crypto assets comes with a risk of financial loss.

With a background in journalism, Ritika Sharma has worked with many reputed media firms focusing on general news such as politics and crime. She joined The Coin Republic as a reporter for crypto, and found a great passion for cryptocurrency, Web3, NFTs and other digital assets. She spends a lot of time researching and delving deeper into these concepts around the clock, and is a strong advocate for women in STEM.


