
 Home
Home News
News
- The token is facing resistance near the 200 EMA on the daily chart.
- The pair of AR/USDT is trading at the price level of $11.653 with a gain of 10.98% in the past 24 hours.
The Arweave (AR) token has broken above the resistance level on the daily time frame with strong bullish momentum and high volume. It remains to be seen if the bulls can continue the bullish momentum and hit new highs.
Arweave token on the daily chart
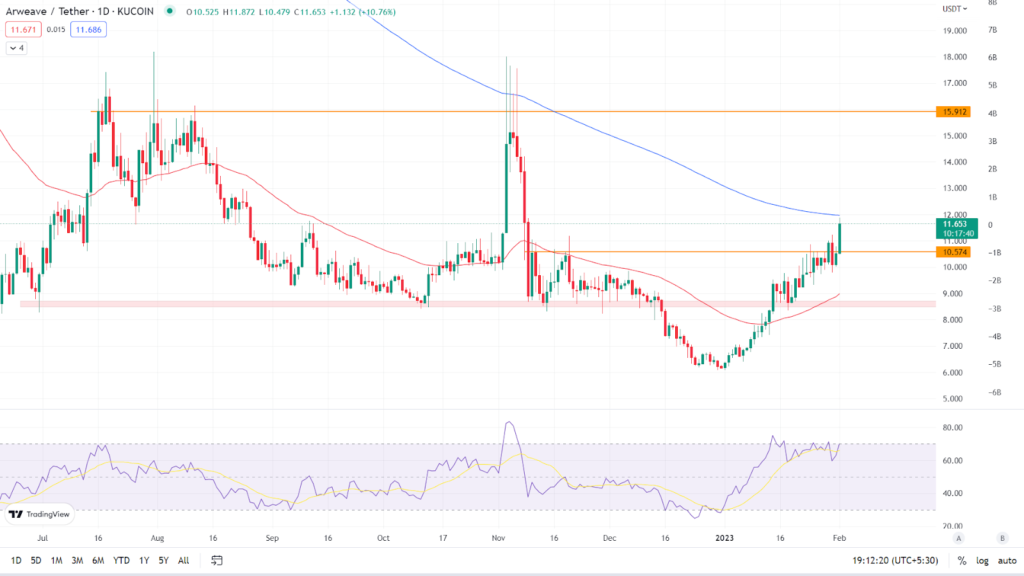
The token has rebounded strongly, and bulls are taking control of the trend, thereby ending bear domination. According to the daily chart, Arweave token is currently trading at $11.653, up 10.98% in the last 24 hours. The token is trading between its key Moving Averages, the 50 EMA and the 200 EMA, and is facing resistance at the 200 EMA. (Red line is 50 EMA and the blue line is 200 EMA). The token should break above the 200 EMA to continue its bullish momentum.
Relative Strength Index: The asset’s RSI curve is currently trading at 70.46, indicating that it is in the overbought zone. The token’s break above the resistance level has increased the value of the RSI curve. The RSI curve has crossed over the 14 SMA, indicating that the token is bullish. If the bulls can continue their bullish momentum in the following days, the RSI curve will remain in the overbought zone.
Analyst view & Expectations
The token recently tried to break over the 200 EMA but was rejected; let’s see if the bulls can cross above the 200 EMA this time and continue to drive the token’s price higher. Investors who want to buy now can do so because the token is in an uptrend, while those who want to trade safely should wait for the token to cross and sustain above the 200 EMA on a daily time frame. Intraday traders, on the other hand, have a good opportunity to go long and book profits based on their risk to reward ratio.
According to our current Arweave price prediction, the value of Arweave is expected to climb by 7.90% in the next few days, reaching $ 12.32. Our technical indicators indicate that the current sentiment is bullish, with the Fear & Greed Index reading 56. (Greed). Over the previous 30 days, Arweave had 21/30 (70%) green days and 15.66% price volatility. According to our Arweave forecast, now is a good time to buy Arweave.
Technical Levels
Major support: $10.574 & 50 EMA on the daily chart
Major resistance: $12.456 & 200 EMA on the daily chart
Conclusion
The bulls have gained strength, forming strong bullish candles with high volume on the chart. Investors can buy now since the token has entered a short-term uptrend, and they can place their stop loss based on their risk-to-reward ratio.
Disclaimer: The views and opinions stated by the author, or any people named in this article, are for informational ideas only, and they do not establish the financial, investment, or other advice. Investing in or trading crypto assets comes with a risk of financial loss.

Nancy J. Allen is a crypto enthusiast, with a major in macroeconomics and minor in business statistics. She believes that cryptocurrencies inspire people to be their own banks, and step aside from traditional monetary exchange systems. She is also intrigued by blockchain technology and its functioning. She frequently researches, and posts content on the top altcoins, their theoretical working principles and technical price predictions.


