
 Home
Home News
News
- The token is trading above its key Moving Averages.
- The pair of FXS/USDT is trading at the price level of $9.600 with a decrease of -6.90% in the past 24 hours.
In the past few weeks, the FRAX (FXS) token has gained more than 150%, forming a strong bullish candle on the daily chart with high volumes. FXS is an ERC-20 token that was created on the Ethereum network. Its key applications include governance, minting, staking, and redeeming FRAX, as well as liquidity incentives.
FXS token on the daily chart
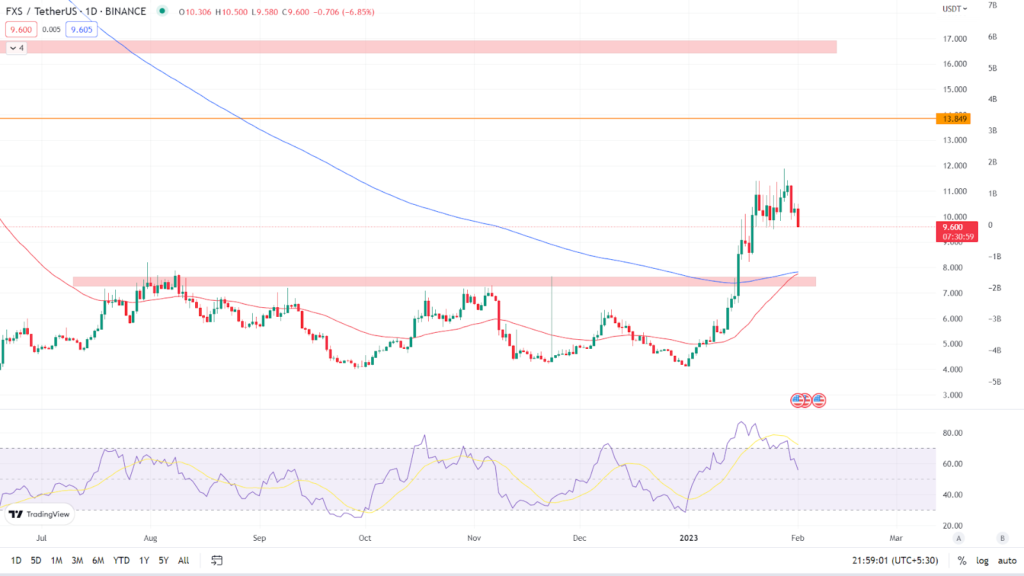
The token has strongly broken over the resistance level, forming bullish candles with a huge body. According to the daily chart, FXS token is currently trading at $9.600, indicating a -6.90% loss in the last 24 hours. The token has crossed and sustained above its key Moving Averages of 50 and 200 EMA. (Red line is 50 EMA and the blue line is 200 EMA).
Relative Strength Index: The asset’s RSI curve is currently trading at 57.12, just above the 50-point mark. As the token forms a strong bearish candle, the RSI curve value falls. The RSI curve has crossed below the 14 SMA, indicating bearishness. The uptrend has come to a halt and is about to retrace. If the bulls are able to maintain their bullish momentum after a retracement, the RSI curve will begin to rise again.
Analyst view & Expectations
After breaking through the $7.643 resistance level, the token is set to retrace. The token which takes retracement after the breakout is often said to be a successful breakout. Investors should hold their buys and wait for the token to retrace and show signs of bullish momentum before buying. Intraday traders, on the other hand, have a good opportunity to go short and aim towards $7.643 and book profits based on their risk to reward ratio.
According to our current Frax Share price prediction, the value of Frax Share is expected to climb by 13.50% over the next several days, reaching $ 11.00. Our technical indicators indicate that the current sentiment is bearish, with the Fear & Greed Index reading 56. (Greed). Over the previous 30 days, Frax Share had 19/30 (63%) green days and 30.05% price volatility. According to our Frax Share forecast, now is not a good time to buy Frax Share.
Technical Levels
Major support: $8.343 & $7.643
Major resistance: $11 & $13.849
Conclusion
The token after showing bullish momentum is now heading for a retracement and is not advised for the investors to buy now. They should wait for a clear indication before acting.
Disclaimer: The views and opinions stated by the author, or any people named in this article, are for informational ideas only, and they do not establish the financial, investment, or other advice. Investing in or trading crypto assets comes with a risk of financial loss.

Andrew is a blockchain developer who developed his interest in cryptocurrencies while pursuing his post-graduation major in blockchain development. He is a keen observer of details and shares his passion for writing, along with coding. His backend knowledge about blockchain helps him give a unique perspective to his writing skills, and a reliable craft at explaining the concepts such as blockchain programming, languages and token minting. He also frequently shares technical details and performance indicators of ICOs and IDOs.


