
 Home
Home News
News
APT token this week is showing a slight sideways momentum wavering the sharp rise. Bulls snappily hold the earlier gains with decent intraday volumes.
In the recent sessions, the price corrects from the top levels to retest the breakout, which is witnessed on the chart. Aptos token is now taking support on its important FIB levels of 23.6% at $16.38. Aptos price again jumped from the range and is now trading at $16.60.
Moreover, the recent sharp move in the last month shows that the buyers aggressively participated in the rally and made long positions. According to the current price action, glimpses like bears attempt to stretch toward the downside to exit the shorts. Still, the volume of buyers is overly much compared to bears resulting in sideways momentum.
Daily Chart shows Price Entering into a Channel
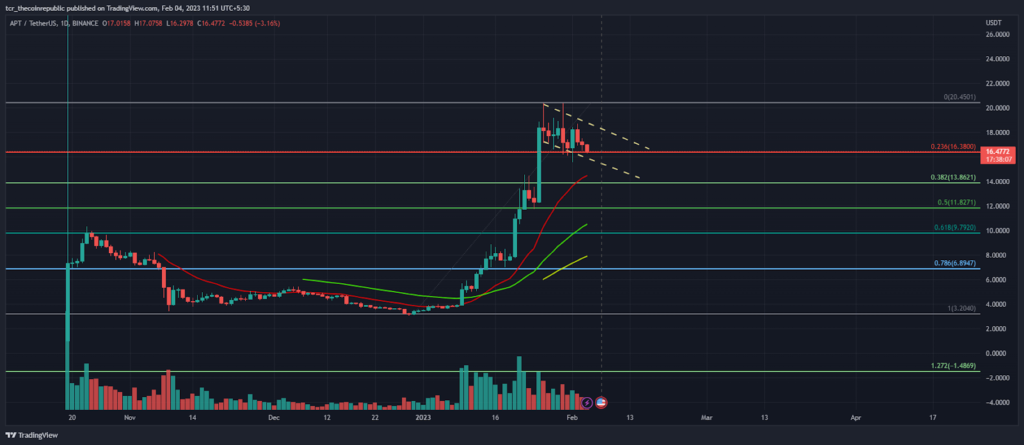
On the daily Chart, APT price, after the long bullish candle, took a break to retest the breakout of the range. Moreover, bears are trapped in the sharp rally, and some are leaving their short positions resulting in short covering moves in the token price. Aptos token price respects the important FIB levels and takes support on it.
Aptos token is now trading at $16.65, with a minute drop of 2% in the last session. Moreover, the trading volume also falls by 20%.
The price action is now signaling the strength of the bulls is looking weaker and ready to retest the 20 EMA support range. In addition, the volumes show a decline, resulting in weak momentum.
Short-term Charts Signaling Price Correction
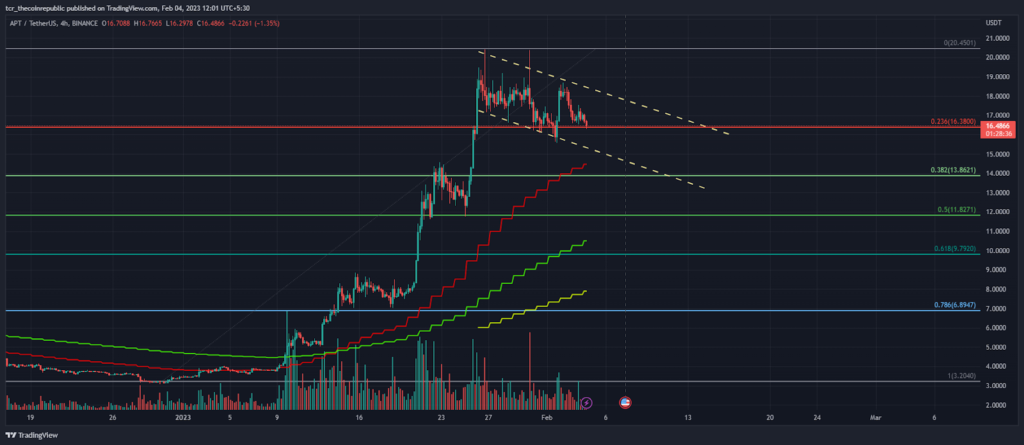
On the 4 hours chart, the APT token creates a flag & pole pattern, which will capture a breakout if it breaks upside. The price is trading inside the channel and still has a bunch of momentum to break the pole range and will shortly register a breakout.
What RSI and MACD say?
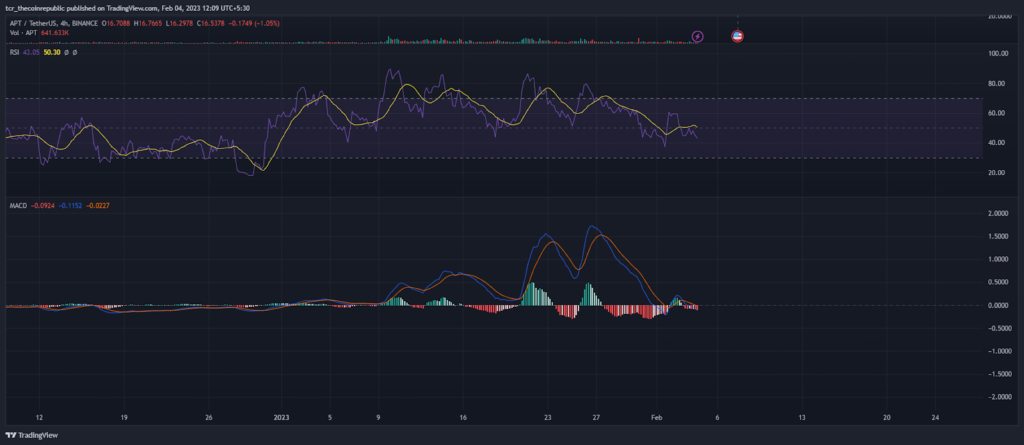
RSI ( Neutral): The RSI is positioned near 40, signalling bearishness to the sideways range. The curve goes downwards from the higher ranges.
MACD: The MACD indicator is now plotting red bars, but the trend is temporarily based on its range, where a crossover is still awaiting.
Technical Levels
Support range: $15
Resistance Level:$18
Conclusion
The Aptos token is looking to retest the 20 EMA support afterward, and a bounce may be seen if the buyer’s volume increases again.
Disclaimer
The views and opinions stated by the author, or any people named in this article, are for informational purposes only, and they do not establish financial, investment, or other advice. Investing in or trading crypto assets comes with a risk of financial loss.

Andrew is a blockchain developer who developed his interest in cryptocurrencies while pursuing his post-graduation major in blockchain development. He is a keen observer of details and shares his passion for writing, along with coding. His backend knowledge about blockchain helps him give a unique perspective to his writing skills, and a reliable craft at explaining the concepts such as blockchain programming, languages and token minting. He also frequently shares technical details and performance indicators of ICOs and IDOs.


