
 Home
Home News
News
- The token has shown bullish actions in the previous sessions.
- The pair of DOT/USDT is trading at the price level of $6.953 with a decrease of -0.81% in the past 24 hours.
The Polkadot (DOT) token has gained traction after breaking over the $5.613 resistance level, and bulls are pushing the token’s price higher. Bulls are fighting back against bears and denying their domination.
DOT token on the daily chart
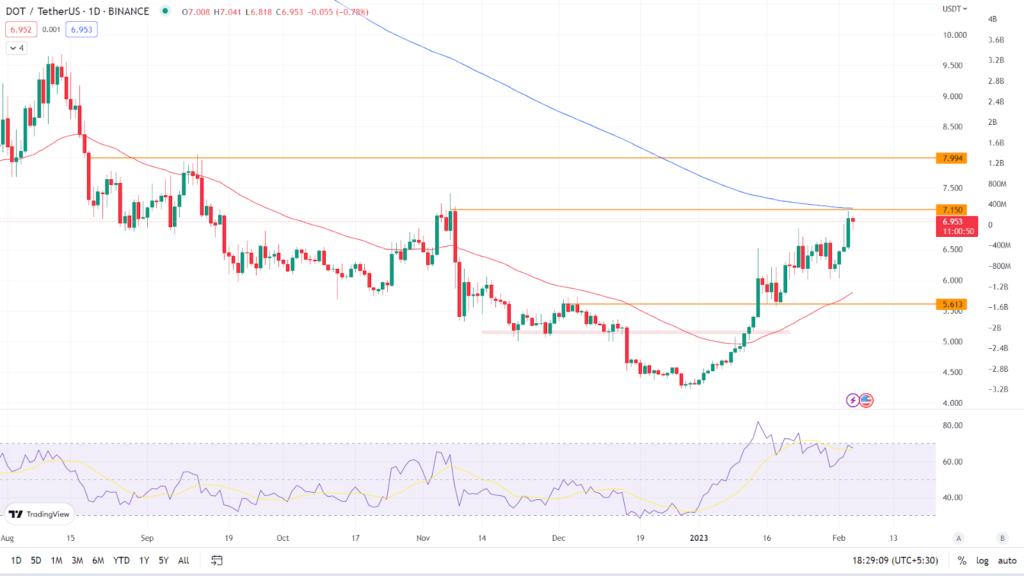
The token has recently formed powerful bullish candles on the daily time frame, indicating bullish momentum. According to the daily chart, DOT token is currently trading at $6.953, indicating a loss of -0.81% in the last 24 hours. The token has crossed and sustained above the 50 EMA, and it is currently trading between its key Moving Averages, the 50 EMA and the 200 EMA. (Red line is 50 EMA and the blue line is 200 EMA). To continue its bullish momentum, the token must cross and stay above the 200 EMA.
Relative Strength Index:The asset’s RSI curve is currently trading at 68.58, indicating that it is in the overbought zone. The value of the RSI curve has increased as the token price has risen. The RSI curve has crossed over the 14 SMA, indicating that the token is bullish. If the price of the token continues to rise, the RSI curve will remain in the overbought zone.
Analyst view & Expectations
On the daily time frame, the token is trading near a critical confluence level of the 200 EMA and the $7.150 resistance level. Investors who want to buy now can do so as the token is showing bullish strength, while those who want to trade safely can wait for the token to cross and sustain above the 200 EMA. Intraday traders, on the other hand, have a good opportunity to go long and book profits based on their risk to reward ratio.
Polkadot’s value is expected to climb by 5.99% over the next few days, reaching $ 7.36, according to our current Polkadot price prediction. According to our technical indicators, the current sentiment is Neutral, with the Fear & Greed Index reading 58. (Greed). Polkadot had 20/30 (67%) green days with 11.84% price volatility during the previous 30 days. According to our Polkadot prediction, now is a good time to buy Polkadot.
Technical Levels
Major support: $6.613
Major resistance: $7.150
Conclusion
The bulls have taken command of the trend and are driving up the price of the token, forming a bullish chart pattern, according to the price action. Investors may either wait for the token to cross the 200 EMA before buying, or they can buy now.
Disclaimer: The views and opinions stated by the author, or any people named in this article, are for informational ideas only, and they do not establish the financial, investment, or other advice. Investing in or trading crypto assets comes with a risk of financial loss.

Nancy J. Allen is a crypto enthusiast, with a major in macroeconomics and minor in business statistics. She believes that cryptocurrencies inspire people to be their own banks, and step aside from traditional monetary exchange systems. She is also intrigued by blockchain technology and its functioning. She frequently researches, and posts content on the top altcoins, their theoretical working principles and technical price predictions.


