
 Home
Home News
News
- Shib token price breakout from the previous month’s high and is up by 46% on the monthly basis
- Shiba Inu token price sustained above the 50 and 200-day EMA
- Shiba Inu technical indicators turned bullish and price action also favors the bulls
Shiba Inu crypto price is trading with bullish cues and bulls are trying to keep the price above the 200-day EMA to show their dominance on the lower levels. At the time of writing, the pair of SHIB/USDT was trading at $0.00001384 with intraday gains at 8.81% and the 24-hour volume-to-market cap ratio stood at 0.0143
What changes in the Shib price overnight?
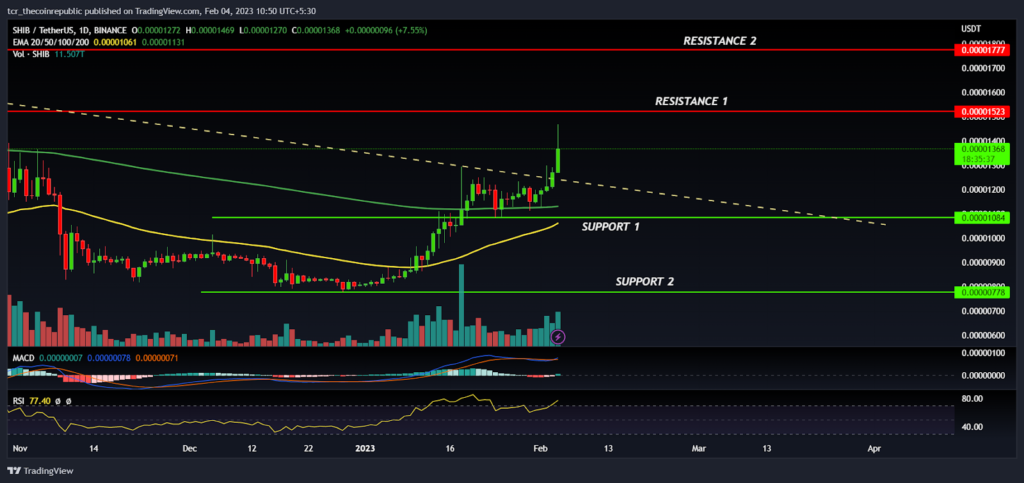
On a daily time frame, Shiba Inu price is reversing upward with the positive momentum and forming higher high candles which have created hope for bullish investors. In the mid of January, SHIB price reclaimed the 50-day EMA(yellow) which derived a positive sentiment and prices rallied almost 57% in the short span of time.
Shib token price holds the 200-day EMA and broke out of the downward sloping trendline with the giant bullish candle indicating that the positional trend has reversed in the favor of bulls, and buyers are expecting more upward movement in the coming days. However, SHIB’s price is near the supply zone and $0.00001523 will act as the immediate hurdle level for the bulls followed by the next hurdle at $0.00001777.
Shiba Inu technical indicators are turning bullish and the buying volume is also increasing on a daily basis showing the confidence of buyers in the lower levels. However, if market sentiments turn negative then it can affect the token price for a short period of time and might see a minor sell-off from the higher levels. On the lower side $0.00001084 will act as the savior for the bulls and dips will provide an opportunity to accumulate for the bullish investors. The MACD had generated a positive crossover indicating bullishness whereas the RSI at 78 denotes an overbought zone which can be a matter of concern for traders.
Summary
After analyzing the Shiba Inu token it seems like the price is bottomed out and reversing upward in the favor of bulls. The technical analysis suggests that if the price holds the 200-day EMA then SHIB can continue the upward momentum. Therefore, traders may look for buying opportunities for the target of $0.00001600 and above by keeping $0.00001000 as SL
Technical levels
Resistance levels: $0.00001523 and $0.00001777
Support levels: $0.00001084 and $0.00000778
Disclaimer
The views and opinions stated by the author, or any people named in this article, are for informational purposes only, and they do not establish financial, investment, or other advice. Investing in or trading crypto assets comes with a risk of financial loss.

Andrew is a blockchain developer who developed his interest in cryptocurrencies while pursuing his post-graduation major in blockchain development. He is a keen observer of details and shares his passion for writing, along with coding. His backend knowledge about blockchain helps him give a unique perspective to his writing skills, and a reliable craft at explaining the concepts such as blockchain programming, languages and token minting. He also frequently shares technical details and performance indicators of ICOs and IDOs.


