
 Home
Home News
News
- PYPL stock price got rejection from the downward sloping trendline and formed a giant bearish candle
- PYPL stock technical indicators is turning bearish
- NASDAQ: PYPL stock is down by 6.78% on the weekly basis and formed a bearish pattern
PayPal Holdings Inc (NASDAQ: PYPL) stock price is trading with bearish cues and bear’s are trying to take the advantage of Q4 earnings to give more pain to its long term investors. However, prices are near to the support levels and it may trigger a wild short covering after the release of Q4 earnings. In the previous session NASDAQ: PYPL stock price closed at $79.72 with the intraday loss of 4.22% and the market cap stood at $90.883B
According to data from Yahoo finance, An average earning estimate for the PYPL Q4 is $1.2 and the revenue estimates stood at $17.39B
PayPal stock shows bearish signs before the Q4 release
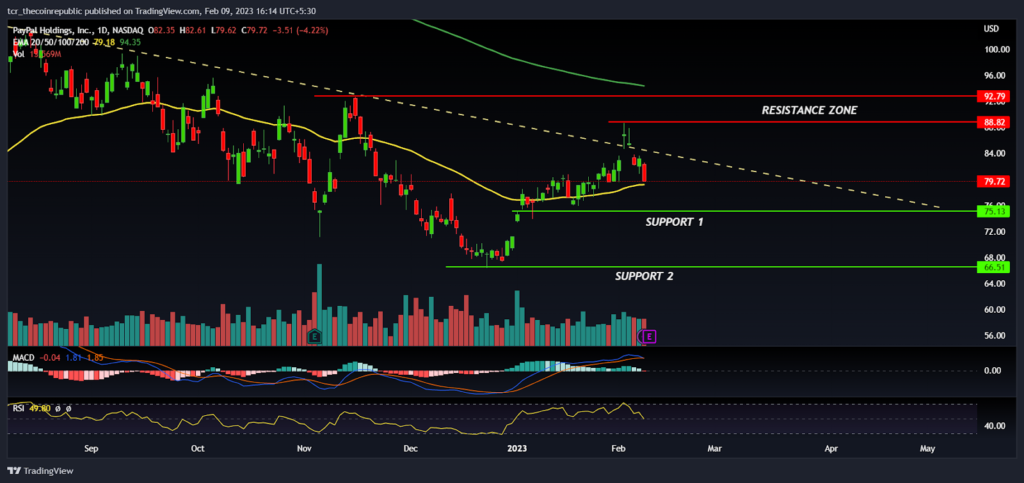
On a daily time frame, PayPal Holdings Inc (NASDAQ: PYPL) stock price is in downtrend and slipping down by forming lower low swings which shows that the bear’s are continuously dominating on the higher levels. Recently, In the mid of January, PYPL prices reclaimed the 50 day EMA which had created a hope for the long term investors and prices shot up 16% approx in the short span of time but unfortunately PYPL bulls took halt at $88.00 hurdle level while forming a rejection candle and later prices lost all its previous gains.
At present, PayPal stock prices had succeeded to defend the 50 day EMA support which seems to be important level for the bullish traders and if PYPL Q4 earnings succeed to beat the street estimates then we may see a wild short covering rally towards $88.00 level which can create a trouble for the bear’s at the supply zone.On the higher side, $88.82 will be acting as a immediate hurdle for the bulls and if bulls able to breakout of the hurdle level then the probability of positional trend reversal will drastically increase in the favor of bulls.
The technical indicators of the PayPal stock like MACD is on the way to generate a negative crossover indicates bearishness, The RSI at 49, reversing down from the overbought zone has entered the neutral level and the price action is also indicating the downward movement. On the other hand, prices are near to the support levels and it will be risky to build short positions till prices hold the $76.00 level. However, if prices break the $76.00 level then it will trigger negative sentiment and bear’s will try to drag the prices toward yearly lows.
Summary
PayPal Holdings Inc (PYPL) stock is showing a bearish price pattern before the Q4 earnings and other technical indicators are also indicating the downward movement. However, if PYPL beats the Q4 estimates then we may see a turn around and a surprising short covering rally towards $90.00 level.
Technical levels
Resistance levels : $88.82 and $92.79
Support levels : $75.00 and $66.51
Disclaimer
The views and opinions stated by the author, or any people named in this article, are for informational ideas only, and they do not establish financial, investment, or other advice. Investing in or trading crypto assets comes with a risk of financial loss.

Nancy J. Allen is a crypto enthusiast, with a major in macroeconomics and minor in business statistics. She believes that cryptocurrencies inspire people to be their own banks, and step aside from traditional monetary exchange systems. She is also intrigued by blockchain technology and its functioning. She frequently researches, and posts content on the top altcoins, their theoretical working principles and technical price predictions.


