
 Home
Home News
News

- The token is trading below the supply zone on the daily time frame.
- The pair of VET/USDT is trading at the price level of $0.0255 with a decrease of -1.07% in the past 24 hours.
The Vechain (VET) token has gained more than 60% in the past few weeks and bulls are enjoying their dominance over the bears. It remains to be seen how long the bulls can continue this bullish momentum.

VET token on the daily chart
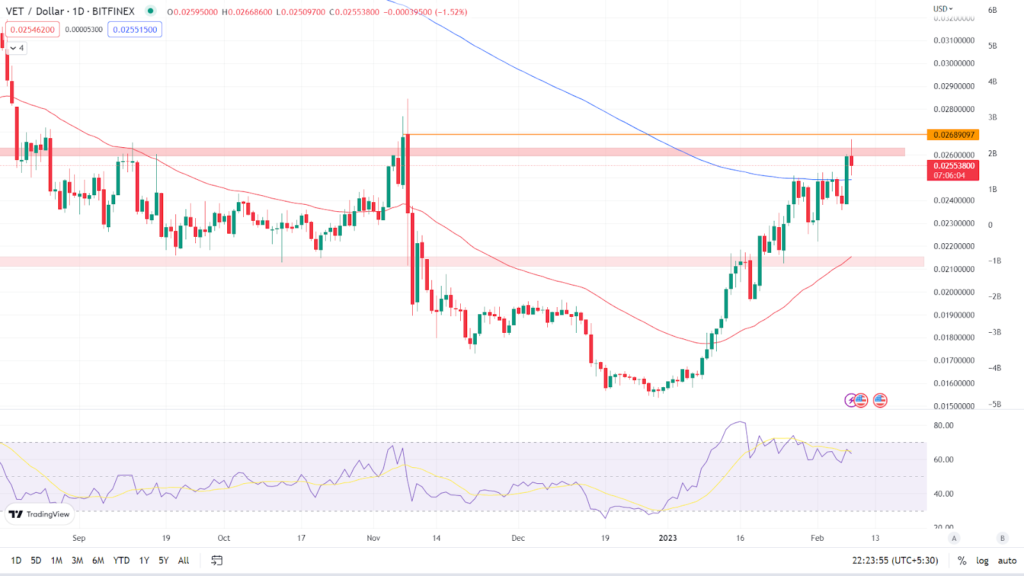
The uptrend of the token has come to a halt as the token is facing resistance at the supply zone on the daily time frame. As we can see on the daily chart, the VET token is currently trading at $0.0255 with a loss of -1.07% in the past 24 hours. The token has crossed and sustained above its key Moving Averages which are 50 EMA and 200 EMA. (Red line is 50 EMA and the blue line is 200 EMA). The bullish momentum will be continued once the token breaks above the supply zone.

Relative Strength Index: The RSI curve of the asset is currently trading at 63.97 and is declining in the value as the token faces rejection from the supply zone. The recent bearishness has led the RSI curve to cross the 14 SMA downward. If the bulls are not able to hold the bears and the token continues to decline in value then the RSI curve will drop even further.
Analyst view & Expectations
The token is facing rejection from the supply zone once again and for the bulls to continue the bullish momentum it needs to break and sustain above the supply zone. Investors are advised to hold their buys and wait for a clear indication before acting. Whereas, intraday traders have a good opportunity to go short and book profit as per their risk to reward ratio.
According to our current VeChain price prediction, the value of VeChain is expected to climb by 19.50% by the next few days, reaching $ 0.030644. Our technical indicators indicate that the current attitude is Neutral, with the Fear & Greed Index reading 58. (Greed). Over the previous 30 days, VeChain had 21/30 (70%) green days and 10.13% price volatility. According to our VeChain forecast, now is a good time to buy VeChain.
Technical Levels
Major support: $0.0230 & 200 EMA on the daily chart.
Major resistance: $0.02630 & $0.0268
Conclusion
The token is facing rejection from the supply zone forming strong bearish candles on the daily time frame. Investors are advised to wait for a clear indication before acting.
Disclaimer: The views and opinions stated by the author, or any people named in this article, are for informational ideas only, and they do not establish the financial, investment, or other advice. Investing in or trading crypto assets comes with a risk of financial loss.
Steve Anderson is an Australian crypto enthusiast. He is a specialist in management and trading for over 5 years. Steve has worked as a crypto trader, he loves learning about decentralisation, understanding the true potential of the blockchain.


