
 Home
Home News
News

- EGLD token price has been on an uptrend as the token price bounced off the demand zone.
- EGLD token price is trading near the supply zone and as of now, it has started consolidating near it.
- The pair of EGLD/BTC trading at the price of 0.0001997 with a decrease of -2.19% in the last 24 hours.
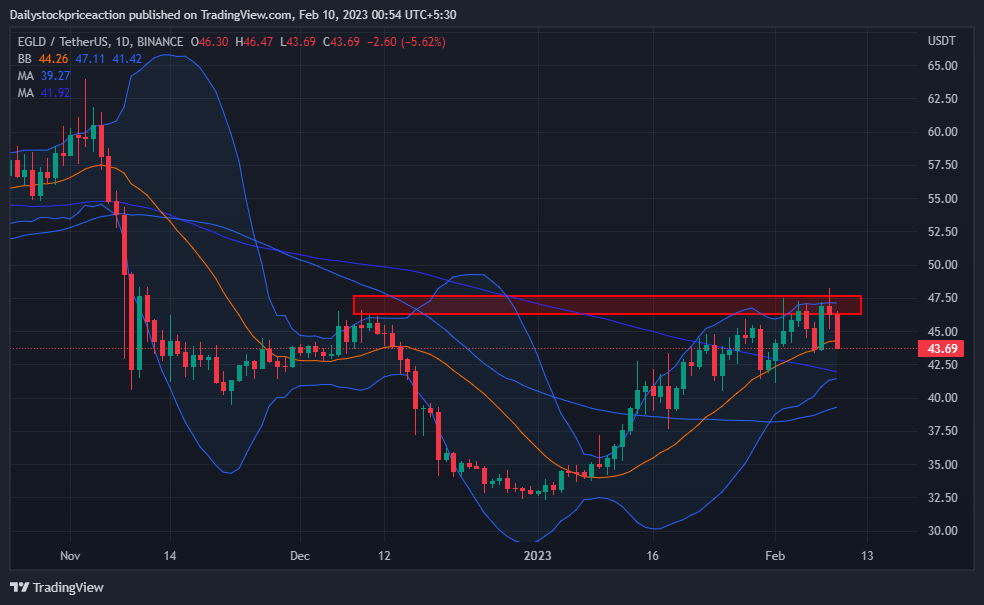
The EGLD token price has rebounded off the demand zone while in an uptrend over the last 24 hours. Token prices are still circling the available supply. On a daily basis, it has formed a bearish rejection candlestick pattern. It has developed a pattern with a rounded bottom on a daily basis.

On a daily basis, the EGLD token’s price is generating higher high and higher low formations. After breaking through every short-term resistance, the token price is currently trading in the supply zone. The price of the EGLD token has recovered from the lower band of the Bollinger band indicator and is now trading at the upper band of the indicator. The EGLD token’s price has broken out above its 14 SMA and 50 MA on a daily basis. It is currently resting at these Moving averages.

Despite recent gains, the token price has yet to breach the 100 Moving Average. As a result, the token price may experience upward rejection before falling precipitously. Despite the previous day’s bullish disaster, volumes have dropped. As a result, investors should exercise caution and wait for a clear trend.
The EGLD token price is forming a rounding bottom pattern on the daily time frame
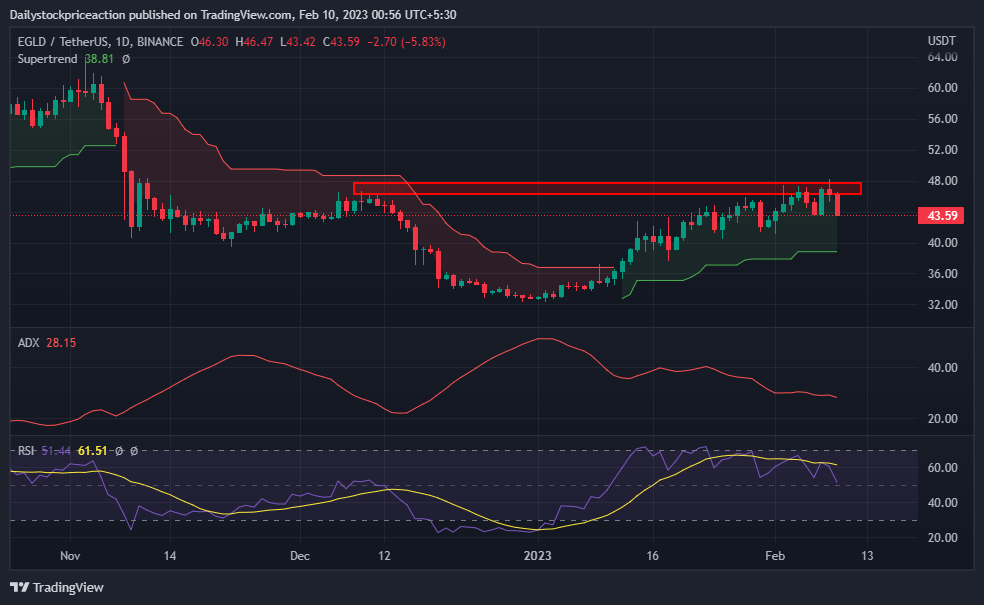
Average Directional Movement Index: As the token continues to fall, the ADX curve has been dipping on a higher time frame. On a daily basis, the ADX curve has exited the 20-point range and begun to rise. On a 4-hour time frame, the club price is in the short-term demand zone. It’s a good sign for the token price. Investors should watch for the formation of a positive candle in the demand zone.
Relative Strength Index: The RSI curve is currently trading at 68.75. The RSI curve has passed the 50-point mark. When the token breaks out of a rounding bottom pattern on a daily time frame, the RSI curve rises. The RSI curve has crossed the 14 EMA yellow line, indicating that the market is bullish in the short term.
Supertrend: Supertrend indicator is positive as the token price broke the important small-term supply zone on the daily timeframe. Since then the token price has failed to give a breakout of the supply zone in a larger time frame. As of now, the token price has broken the super trend sell line which has triggered a buy line.
Conclusion: EGLD token price has been hovering around the supply zone. The technical parameters suggest a bullish move in the upcoming days. The price action is also suggesting the same. It remains to see if the token price will break the rounding bottom pattern or fall heavily
Support: $42 and $40
Resistance: $48 and $52
Disclaimer
The views and opinions stated by the author, or any people named in this article, are for informational purposes only, and they do not establish financial, investment, or other advice. Investing in or trading crypto assets comes with a risk of financial loss

Nancy J. Allen is a crypto enthusiast, with a major in macroeconomics and minor in business statistics. She believes that cryptocurrencies inspire people to be their own banks, and step aside from traditional monetary exchange systems. She is also intrigued by blockchain technology and its functioning. She frequently researches, and posts content on the top altcoins, their theoretical working principles and technical price predictions.


