
 Home
Home News
News

- THETA token is moving in a sideways trend.
- Currently, a bullish pennant pattern has formed the base for a bull move ahead.
- A Golden Crossover may also take place as soon as the price of the token rises.
THETA token is currently fluctuating within a range at the present price levels. So, if this range is broken, a bull move could follow. On the daily chart, we can also notice the formation of a bullish pennant pattern. A strong bull move typically results from the breakout of a bullish pennant.

Monoscopic View
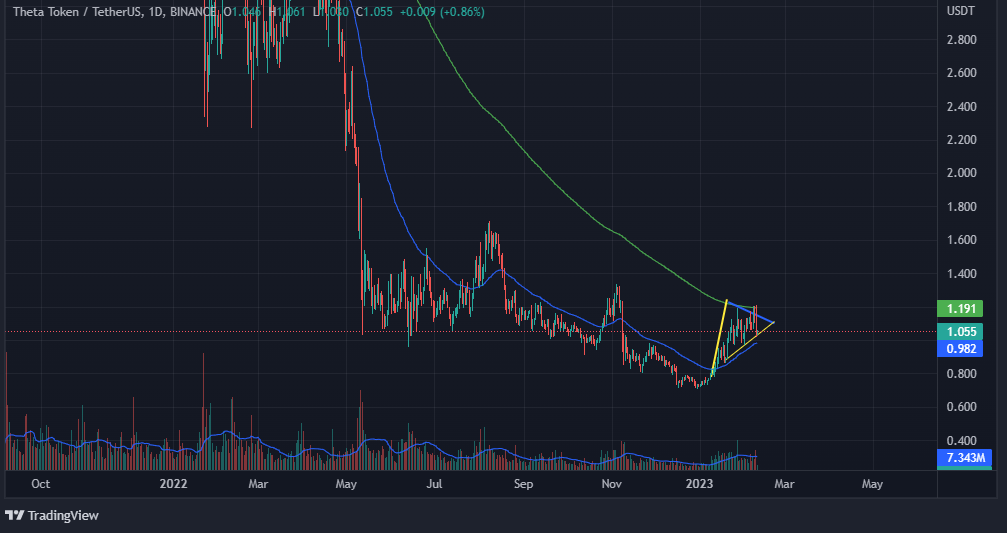
On the daily chart, we can see that the price is moving within the bullish pennant. The upper trendline (the blue line) is acting as the token’s resistance. Therefore, a significant bull move could occur if the price crosses this trendline. In addition, there is also a possibility that the token may not give a breakout of the pattern; instead it may give a breakdown, in which case the prices might fall.

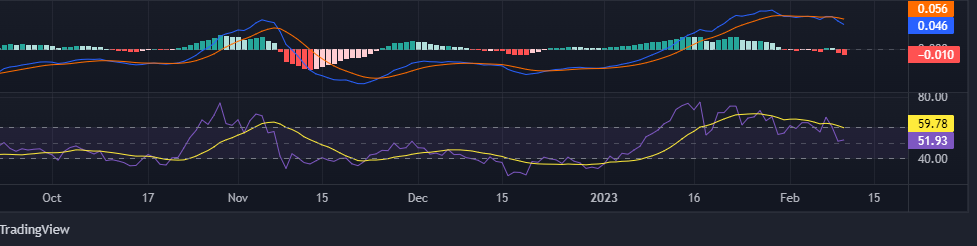
The MACD indicator has shown a bearish crossover which means that the bears have taken over the bulls and as a result we may see a fall in prices. On the other hand, the RSI curve is trading at 51.93 which is above its 50-point mark but still we can’t consider it as a positive signal because the token’s prices are fluctuating within a range so there may be a chance that the RSI value may decrease.
Overall, the RSI indicator is neutral while the MACD indicator is giving a sell signal.
Microscopic View
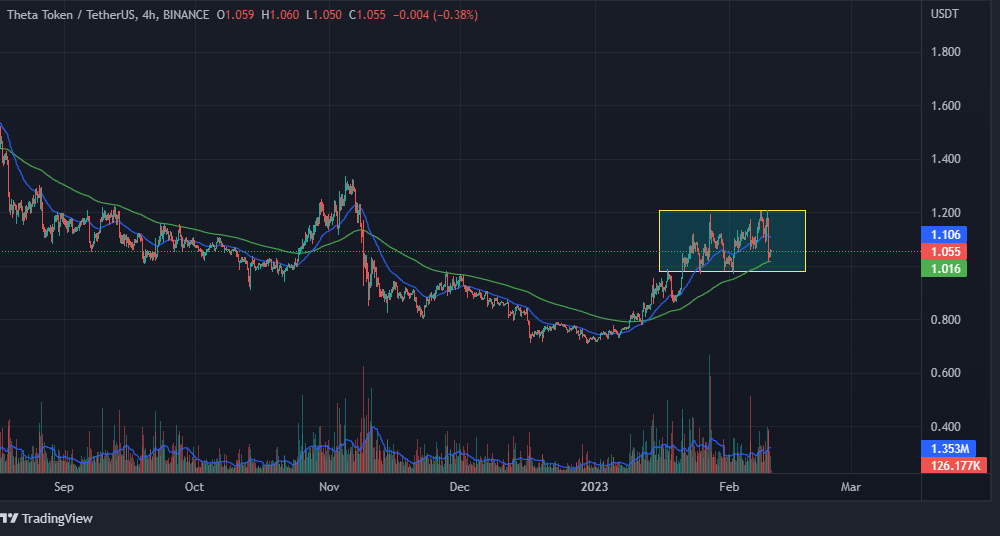
On the short-term chart, we can again see the prices of the token fluctuating within a range similar to the daily chart. One additional thing we can spot on this short-term chart is that earlier a Golden Crossover took place and following which the coin gave a bull move and now at the present time, the 50 EMA is approaching 200 EMA from above which is indicating that a Death Crossover may take place if the price of the token declines.
By February 15, 2023, the price of THETA token is anticipated to increase by 19.34% and reach $1.262430 based on Coin Codex’s most recent price prediction.
Conclusion
THETA is currently moving in a range so if the price breaks out of the range, we may see a bull move. Investors may look forward to buying once the token gives a breakout of the bullish pennant and they can keep a stop loss of around $0.952 in such cases.
Technical Levels
Resistance levels – $1.190 and $1.650
Support levels – $0.952 and $0.738
Disclaimer: The views and opinions stated by the author, or any people named in this article, are for informational purposes only, and they do not establish financial, investment, or other advice. Investing in or trading crypto assets comes with a risk of financial loss.

Andrew is a blockchain developer who developed his interest in cryptocurrencies while pursuing his post-graduation major in blockchain development. He is a keen observer of details and shares his passion for writing, along with coding. His backend knowledge about blockchain helps him give a unique perspective to his writing skills, and a reliable craft at explaining the concepts such as blockchain programming, languages and token minting. He also frequently shares technical details and performance indicators of ICOs and IDOs.


