
 Home
Home News
News
- The token is trading below its key Moving Averages.
- The pair of DOGE/USDT is trading at the price level of $0.08450 with a gain of 2.78% in the past 24 hours.
- EMAs has given a bearish crossover on the daily time frame.
The bears are rejecting the bulls’ highs by forming large bearish candles on the daily chart. The token has failed to sustain its position above the key Moving Averages and has slipped below it.
DOGE token on the daily chart
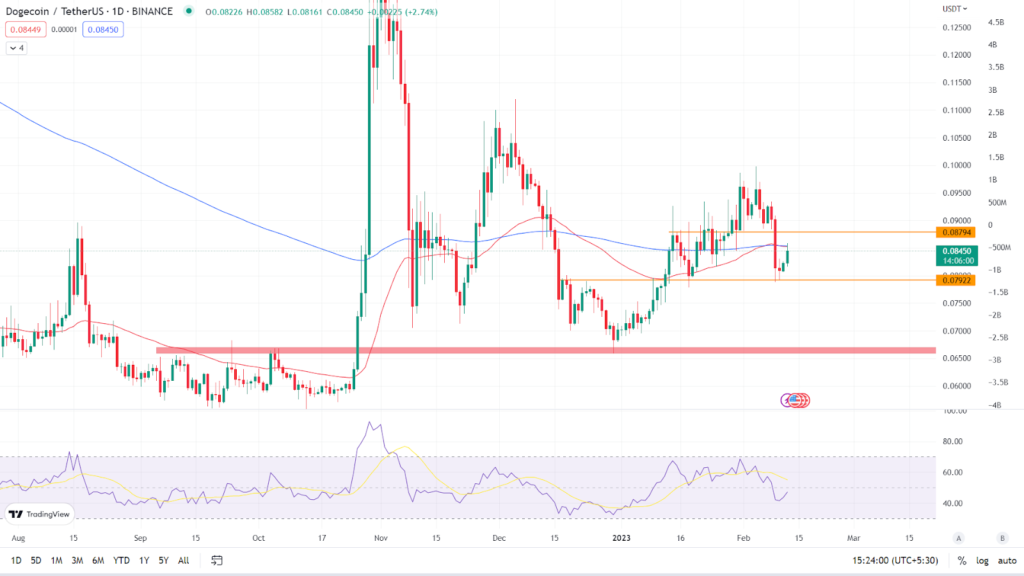
The token is trading at a crucial level and $0.07922 is providing strong support to the token. As we can see on the daily chart, the DOGE token was trading at $0.08450 with a gain of 2.78% in the past 24 hours. The token is trading below its key Moving Averages which are 50 EMA and 200 EMA. (Red line is 50 EMA and the blue line is 200 EMA). The EMAs have given a bearish crossover, when 50 EMA crosses the 200 EMA downward it is known as a bearish crossover.
Relative Strength Index: The RSI curve of the asset is currently trading at 46.54 and has crossed below the halfway mark of the 50 point line. The recent fall in the token has led the value of the RSI curve to decline. The RSI curve has crossed the 14 SMA downward indicating bearishness. If the token falls below the $0.07922 support level and continues to decline then the value of the RSI curve will fall even further.
Analyst view & Expectations
To continue the bullish momentum the token needs to hold the $0.07922 level and break above the $0.08794 resistance level. Investors should buy and wait for the token to break above the resistance level and then buy to get more clarity on the direction of the trend. Whereas, intraday traders have a good opportunity to go long and book their profits as per their risk to reward ratio.
According to our current Dogecoin price prediction, the value of Dogecoin is expected to climb by 9.46% in the coming days, reaching $ 0.091910. Our technical indicators indicate that the current sentiment is bearish, with the Fear & Greed Index reading 50. (Neutral). Over the previous 30 days, Dogecoin had 15/30 (50%) green days and 4.64% price volatility.
Technical Levels
Major support: $0.07922
Major resistance: $0.08794 & 50 EMA on the daily chart.
Conclusion
The token has bounced off the key support level but the EMAs is giving a bearish signal by providing a bearish crossover. Investors should wait for a clear indication before acting.
Disclaimer: The views and opinions stated by the author, or any people named in this article, are for informational ideas only, and they do not establish the financial, investment, or other advice. Investing in or trading crypto assets comes with a risk of financial loss.
Steve Anderson is an Australian crypto enthusiast. He is a specialist in management and trading for over 5 years. Steve has worked as a crypto trader, he loves learning about decentralisation, understanding the true potential of the blockchain.


